Figures & data
Figure 1 Identification of AC012213.3 through bioinformatics analysis and qRT-PCR.
Notes: (A) The lncRNAs differentially expressed between tumor and normal tissue with the threshold of |logFC > 1| and adj.P.value < 0.05; (B) The expression level of AC012213.3 between tumor and normal tissue, **P < 0.01; (C) qRT-PCR was performed to assess the mRNA level of AC012213.3 in 11 paired breast cancer tissue world, **P < 0.01; (D) qRT-PCR was performed to assess the mRNA level of AC012213.3 in breast cancer cell lines, ***P < 0.001.
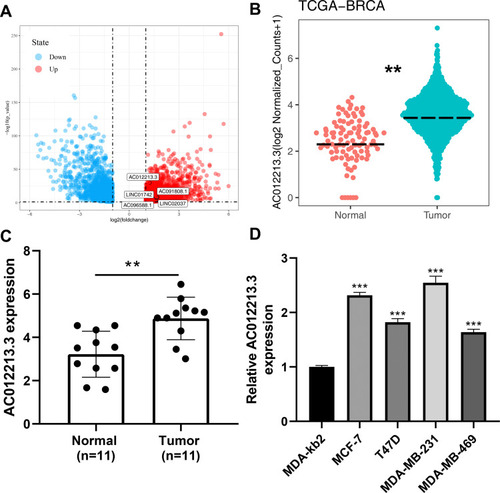
Figure 2 AC012213.3 is correlated with worse clinical features.
Notes: (A) The expression level of AC012213.3 in different age groups, NS. = P > 0.05; (B) The expression level of AC012213.3 in different stage groups, *P < 0.05; (C) The expression level of AC012213.3 in different T-stage groups, ***P < 0.001; (D) The expression level of AC012213.3 in different N-stage groups, **P < 0.01; (E) The expression level of AC012213.3 in different breast cancer subtypes; (F) Kaplan–Meier showed prognosis difference between high and low AC012213.3 patients.
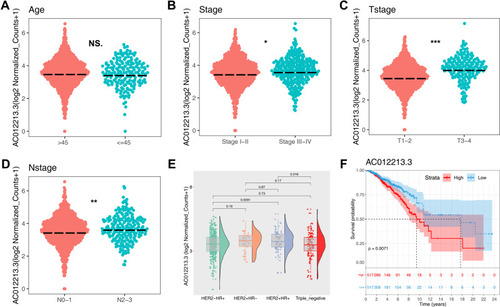
Figure 3 AC012213.3 promotes cell proliferation in breast cancer cells.
Notes: (A and B) qRT-PCR was used to assess the knockdown efficiency of AC012213.3, **P < 0.01, ***P < 0.001; (C) Colony formation assay was performed between control and AC012213.3 knockdown cells, **P < 0.01; (D and E) CCK8 assay was performed between control and AC012213.3 knockdown cells, **P < 0.01; (F) Flow cytometry detecting cell apoptosis was performed between control and AC012213.3 knockdown cells, **P < 0.01.
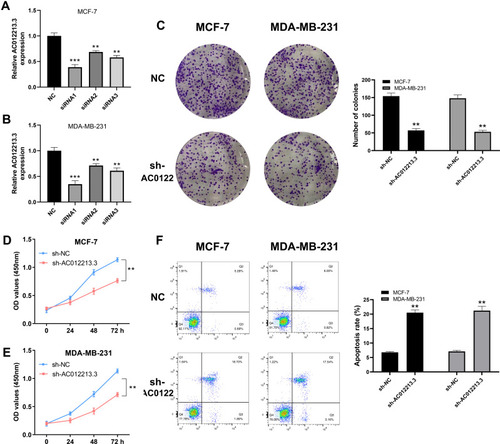
Figure 4 AC012213.3 promotes cell invasion and migration in breast cancer cells.
Notes: (A) Transwell assay was performed to assess the invasion and migration ability in the control and AC012213.3 knockdown group, **P < 0.01; (B) Wound-healing assay was performed between control and AC012213.3 knockdown group.
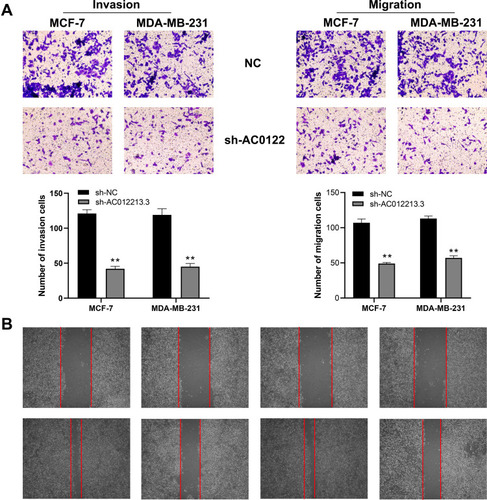
Figure 5 Identification of RAD54B as a target gene of AC012213.3.
Notes: (A) RAD54B was positively correlated with AC012213.3 and associated with patients survival; (B) The linear correlation between AC012213.3 and RAD54B; (C) The expression level of RAD54B between normal and tumor tissue, ***P < 0.001; (D) Kaplan-Meier showed prognosis difference between high and low RAD54B patients; (E) The expression level of RAD54B in different clinical stage groups, *P < 0.05; (F) The expression level of RAD54B in different cell lines, **P < 0.01, ***P < 0.001; (G and H) qRT-PCR was used to assess the RAD54B expression level in control and AC012213.3 knockdown cells, **P < 0.01.
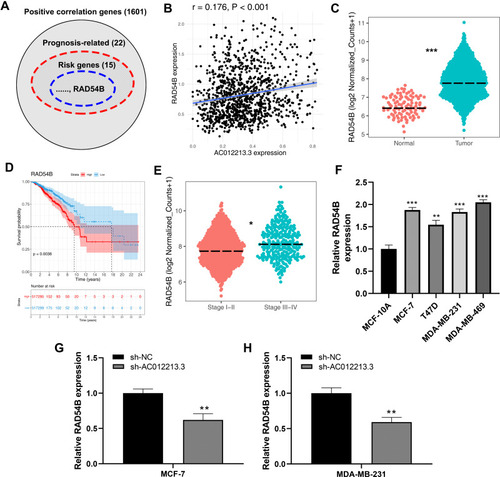
Figure 6 The oncogene effect of AC012213.3 partly depend on RAD54B.
Notes: (A and B) qRT-PCR was used to assess the overexpression efficiency in control and RAD54B-OE cells, ***P < 0.001; (C) Colony formation assay was performed in the control, sh-AC012213.3 and sh-AC012213.3+RAD54B-OE cells, **P < 0.01; (D and E) CCK8 assay was performed in the control, sh-AC012213.3 and sh-AC012213.3+RAD54B-OE cells, **P < 0.01; (F) Transwell assay was performed in the control, sh-AC012213.3 and sh-AC012213.3+RAD54B-OE cells, **P < 0.01.
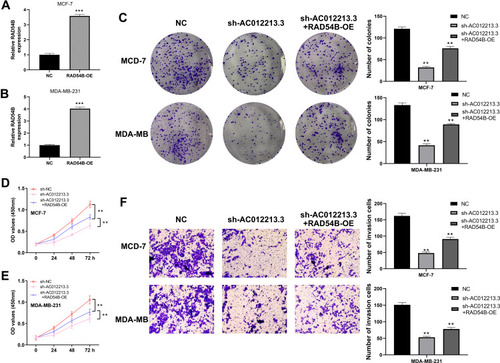
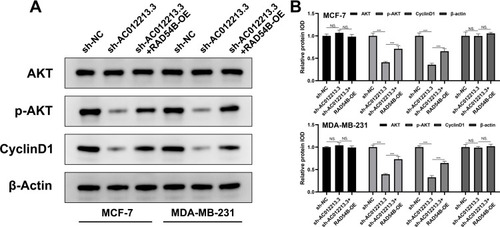
Figure 7 Western blot detecting the marker of PI3K/AKT pathway in different groups.
Notes: (A) Western blot detecting the marker of PI3K/AKT pathway in different groups; (B) The corresponding densitometric analysis, NS. = P <0.05, ***P < 0.001.