Figures & data
Table 1 Chi-Squared Analysis of the Associations Between HLA-F-AS1/MEG3 Expression Levels and Patients’ Clinical Data
Figure 1 Exploration of the differential expression of HLA-F-AS1 and MEG3 in GBM. All 62 GBM patients donated GBM and paired non-tumor tissues, which were used to isolate total RNAs to assay the differential expression of HLA-F-AS1 (A) and MEG3 (B) in GBM through RT-qPCRs. **p < 0.01.
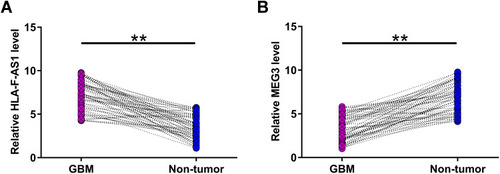
Figure 2 Analysis of the correlations between HLA-F-AS1 and MEG3. Pearson’s correlation coefficient was carried out to explore the correlations between HLA-F-AS1 and MEG3 across both GBM (A) and non-tumor (B) tissues.
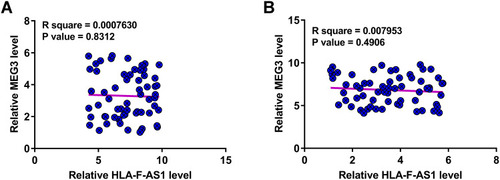
Figure 3 Analysis of the direct interaction between HLA-F-AS1 and MEG3. The interaction between HLA-F-AS1 and MEG3 was first predicted by IntaRNA 2.0 software (A), followed by validation through RNA-RNA pulldown assay (B). **p < 0.01.
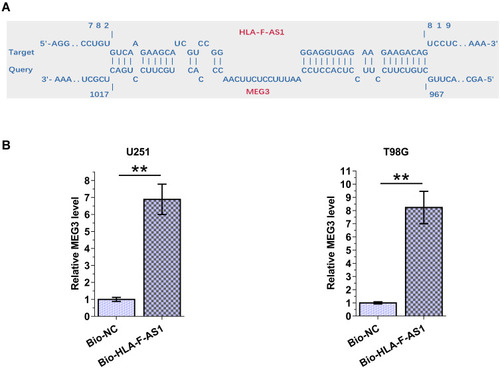
Figure 4 Analysis of the role of HLA-F-AS1 and MEG3 in regulating the expression of each other. Overexpression of HLA-F-AS1 and MEG3 was achieved in U251 and T98G cells. The overexpression of them was confirmed every 24 h until 96 h (A). The role of HLA-F-AS1 in regulating the expression of MEG3 (B), and the role of MEG3 in regulating the expression of HLA-F-AS1 (C) were analyzed with RT-qPCRs. *p < 0.05.
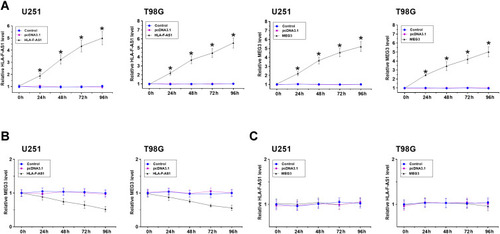
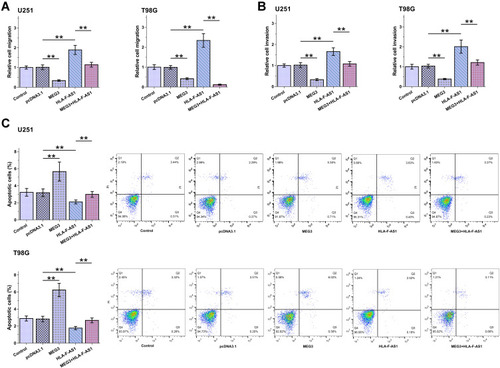
Figure 5 Analysis of the role of HLA-F-AS1 and MEG3 in behaviors of U251 and T98G cells. Transwell assays and cell apoptosis assays were used to explore the role of HLA-F-AS1 and MEG3 in the migration (A), invasion (B) and apoptosis (C) of U251 and T98G cells. **p < 0.01.