Figures & data
Figure 1 The ultrasound view of the QLB3. Medicine: drug solution. The arrow denotes the puncture path of the needle. Compared with left picture, the psoas muscle in right picture is pressed down by the drug solution.
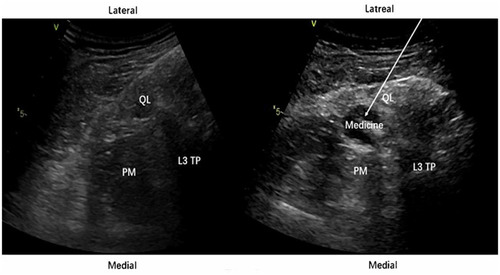
Table 1 Comparison of Demographic Data and Characteristics in the Two Groups
Table 2 Comparison of Adverse Reactions After Operation (Case)
Figure 2 Comparison of postoperative pain scores in the two groups. The VAS scores of rest pain (A) and active pain (B) in the both groups at 0 h (T1), 12 h (T2), 24 h (T3) and 48 h (T4) after surgery. Data represent the mean ± SD, compared with Group C, *P<0.01. Data were compared by Mann–Whitney U-test.
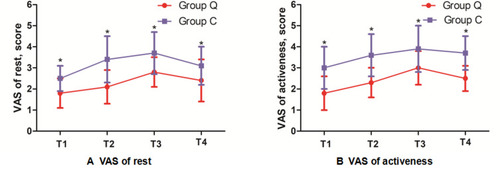
Figure 3 Comparison of postoperative recovery in the two groups. The first time of getting up (A), The first time of flatus (B), The first time of intake semi-liquid diet (C), Postoperative hospital stay (D). Data represent the mean ± SD, compared with Group C, *P<0.01. Continuous data were compared by Student’s t-test.
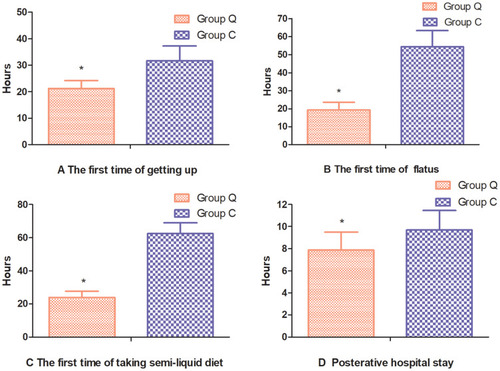
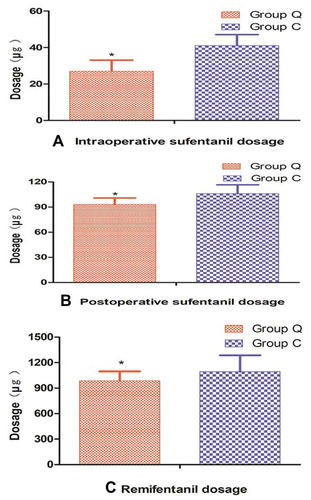
Figure 4 Comparison of analgesic drugs dosage in the two groups. Intraoperative sufentanil dosage (A), Postoperative sufentanil dosage (B), Remifentanil dosage (C). Data represent the mean ± SD, compared with Group C, *P<0.05. Continuous data were compared by Student’s t-test.