Figures & data
Table 1 Clinicopathological Features and CSS Rates for 311 PSCC Patients
Table 2 Univariate Analysis for CSS in 311 PSCC Patients
Table 3 Predictive Value of Different Variants and Prognostic Models in 311 PSCC Patients
Figure 1 Novel nomogram 1 predicting cancer-specific survival of postoperative PSCC patients.
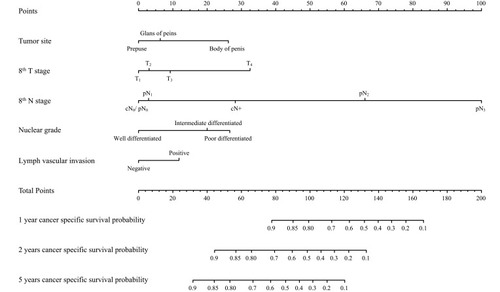
Figure 2 Novel nomogram 2 predicting cancer-specific survival of postoperative PSCC patients.
Abbreviation: AJCC, American Joint Committee on Cancer.
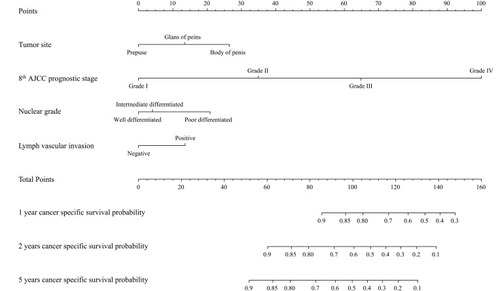
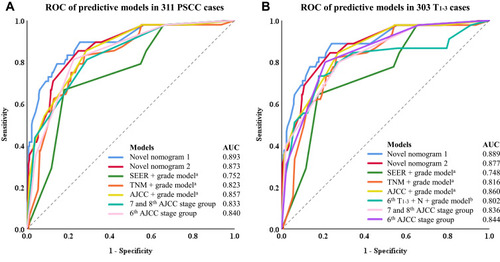
Figure 3 ROC curve of different models. (A) ROC of predictive models in 311 PSCC cases. (B) ROC of predictive models in 303 T1-3 cases. aReported by Thuret et al;Citation7 breported by Thuret et al.Citation8
Abbreviations: AJCC, American Joint Committee on Cancer; AUC, Area Under the Curve; ROC, Receiver Operating Characteristic Curve; SEER, Surveillance, Epidemiology, and End Results Program.