Figures & data
Table 1 Clinicopathologic Characteristics of Patients Enrolled in the Study
Table 2 Histological Subtypes and Components of T790M Mutationsa
Table 3 Conventional Computed Tomography (CT) Imaging Characteristics Before Treatment
Figure 1 Images of a 48-year-old female tyrosine kinase inhibitor (TKI)-naive patient with T790M mutation-positive non-small-cell lung cancer (NSCLC). (A) Computed tomography (CT) image in the axial lung window setting showing a 1.2-cm lung nodule in the right upper lobe under the horizontal fissure, with an internal air bronchogram. (B) Axial CT image showing multiple ground-glass nodules in the bilateral lungs.
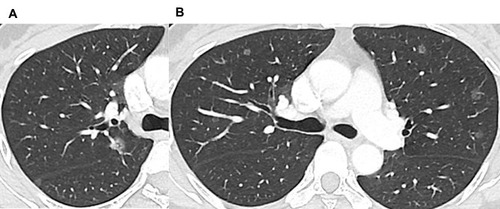
Figure 2 A combined model identifying primary and acquired T790M mutations. (A) Combined model identifying both primary and acquired EGFR T790M mutations. (B and C) Receiver operating characteristic curves for the computed tomography (CT) radiomic signature, routine clinical signature, and combined model in training (B) and validation (C) cohorts. (D and E) Calibration curves of the combined model in the training (D) and validation (E) cohorts. AUC, area under the receiver operating characteristic curve.
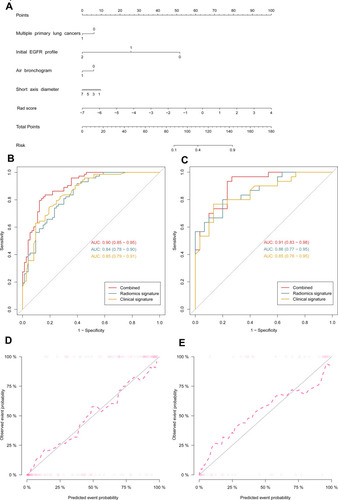
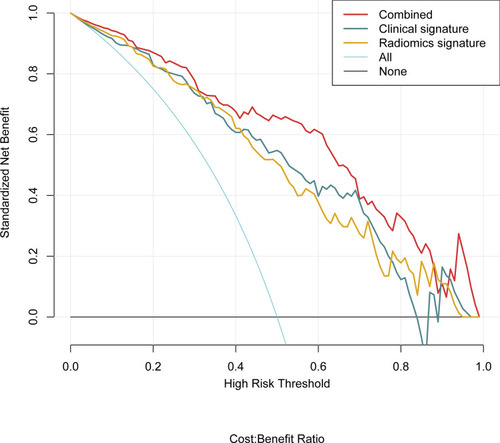
Figure 3 Decision curve analysis for the combined model in the validation cohort. The y-axis represents the net benefit. The light purple line represents the hypothesis that all patients have the primary T790M mutation; the black line represents the hypothesis that all patients have the acquired T790M mutation. The combined model (red in the figure) improves the performance of T790M mutation prediction with more areas than the computed tomography (CT) radiomic or clinical signatures alone.