Figures & data
Table 1 Pathway Sources
Table 2 Genes Analyzed
Figure 1 (A) The expression of SOS1 significant at 48 hr (B) The expression of RRAS significant at 48 hr (C) The expression of NFKB significant at D8 and D15.
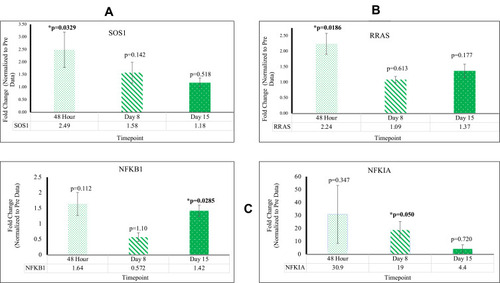
Figure 2 (A) The expression of VEGFB significant at all timepoints (B) The expression of ANGPT1 significant at D8 (C) The expression of SYNE1 significant at D8 and D15.
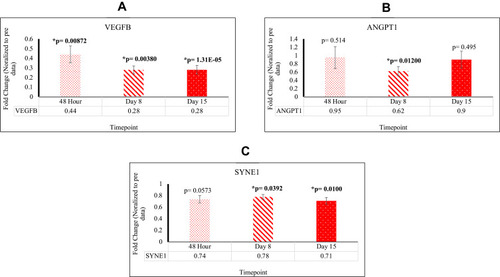
Figure 3 (A) The expression of CASP8 significant at D8 and D15 (B) The expression of CASP9 significant at D8 (C) The expression of JUN significant at D15 (D) The expression of IGF2 significant at D8.
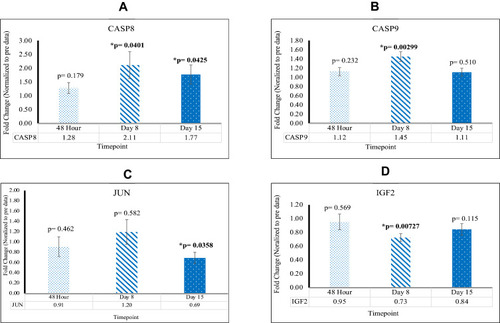
Figure 4 (A) The expression of CHORDC1 significant at 48hr and D15 (B) The expression of MIR16-2 significant at D15 (C) The expression of RTN4 significant at 48hr (D) The expression of FAM96A significant at 48hr.
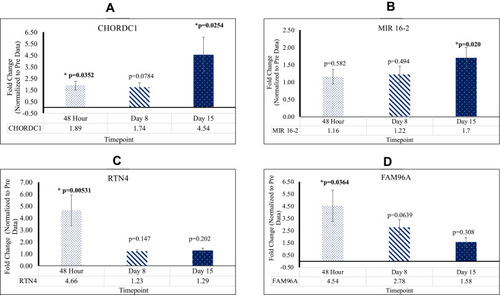
Figure 5 (A) The expression of SOS1 significant at 48 hr (B) The expression of RRAS significant at 48 hr (C) The expression of PIK3CB significant at D8 and D15 (D) The expression of NOS3 significant at D15.
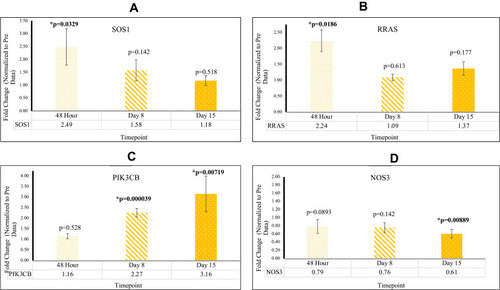
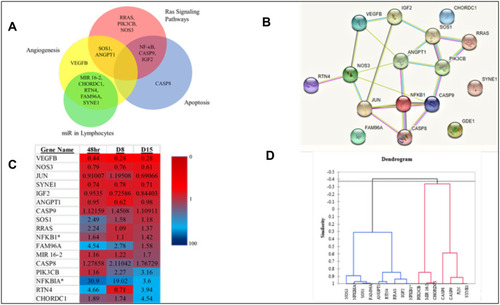
Figure 6 (A) Venn Diagram exhibiting pathway relationships between the primary 16 genes (B) STRING interaction network (GDE1 is an alias for MIR16-2). *Indicates a subunit of NF-κB. (C) Heat Map with fold changes from all 16 genes (D) Dendrogram showing statistical similarities between the 16 genes.