Figures & data
Table 1 Summary of Clinical Characteristics of Patients with Classical Hodgkin Lymphoma (N = 384)
Figure 1 Conditional survival and annual hazard estimates of death and failure for classical Hodgkin lymphoma patients (N = 384). (A) COS or conditional overall survival is a function of the number of surviving years. (B) CFFS or conditional failure-free survival is a function of the number of failure-free years. The differently colored lines represent the years of survival and failure-free survival after treatment, ranging from 0 to 5 years. (C) The probability of 5-year conditional survival is a function of the number of surviving or failure-free years since treatment (Error bars denote 95% CIs). (D) Smoothed plots of the annual estimates of death hazard and failure hazard according to time after treatment.
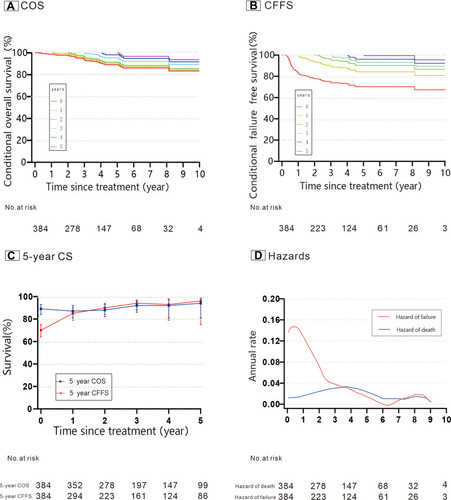
Figure 2 Conditional survival and hazard estimates of early-stage patients (n = 218) and advanced-stage patients (n = 166) with classical Hodgkin lymphoma. (A) 5-year COS is the 5-year conditional overall survival over time of both early-stage and advanced-stage patients. (B) 5-year CFFS is the 5-year conditional failure-free survival over time of both early-stage and advanced-stage patients. The lines linearly connect different estimates (Error bars denote 95% CIs). (C and D) Smoothed plots of hazard estimates of death over time (C) and failure over time (D) for early-stage and advanced-stage patients.
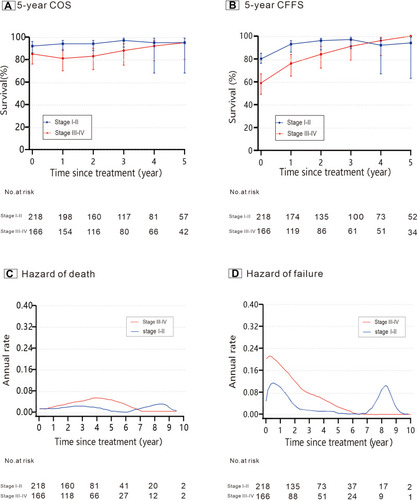
Figure 3 Conditional survival and hazard estimates stratified by risk groups in early-stage patients (n = 218). (A) 5-year COS is the 5-year conditional overall survival of early-stage patients with unfavorable and favorable factors over time. (B) 5-year CFFS is the 5-year conditional failure-free survival of early-stage patients with unfavorable and favorable factors over time (Error bars denote 95% CIs). (C and D) Smoothed plots of hazard estimates of death over time (C) and failure over time (D) for early-stage patients with favorable and unfavorable factors.
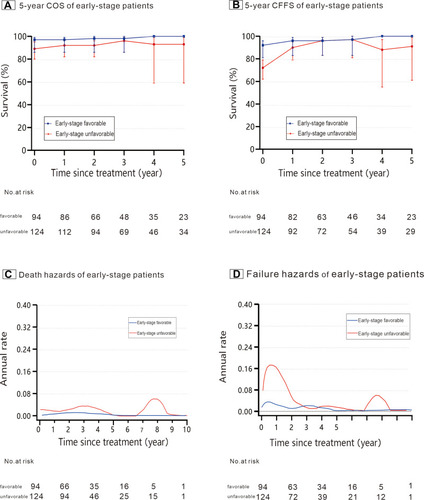
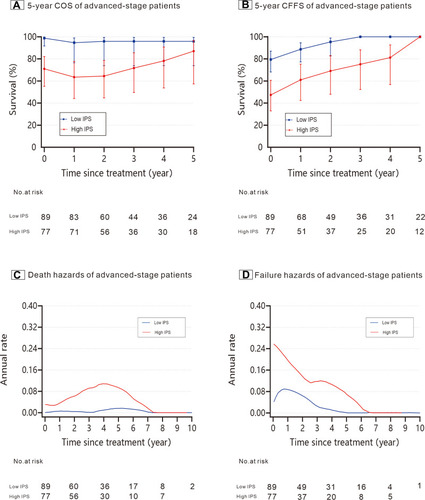
Figure 4 Conditional survival and hazard estimates stratified by risk groups in advanced-stage patients (n = 166). (A) 5-year COS is the 5-year conditional overall survival over time in advanced-stage patients with low IPS score and high IPS scores. (B) 5-year CFFS is the 5-year conditional failure-free survival over time in advanced-stage patients with low IPS score and high IPS scores. The lines linearly connect different estimates (Error bars denote 95% CIs). (C and D) Smoothed plots for the hazard estimates of death over time in advanced-stage patients who had low IPS scores and high IPS scores (C), and smoothed plots for the hazard estimates of failure over time in advanced-stage patients who had low IPS scores and high IPS scores (D).