Figures & data
Figure 1 HK-II expression in laryngeal carcinoma tissues (A) and in paracarcinoma tissues (B).
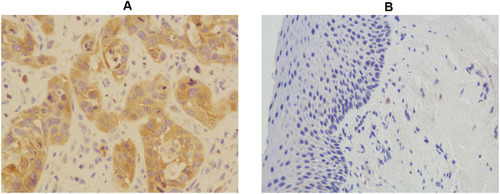
Figure 2 Verification of HK-II siRNA. (A) qRT-PCR results. (B) Western blotting results. (*p<0.05, **p<0.01, #p<0.05, ##p<0.01, and ^^p<0.01).
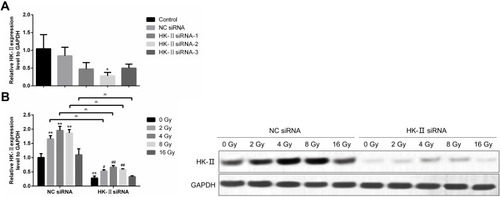
Figure 3 Effects of HK-II siRNA treatment on the viability, cell survival, proliferation, apoptosis, and cell cycle of Tu212 cells. (A) Colony formation assay. (B) CCK-8 assay. (C) Cell cycle. (D) Trypan blue staining. (E) Apoptosis of Tu212 cells. (**p<0.01, ##p<0.01, and ^^p<0.01).
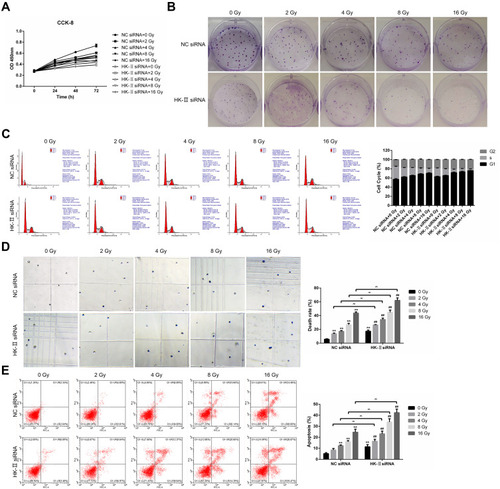
Figure 4 Effects of HK-II overexpression treatment on the viability, cell survival, proliferation, apoptosis, and cell cycle of Tu212 cells with radiotherapy and HK-II siRNA treatment. (A) Western blotting results. (B) CCK-8 assay. (C) Colony formation assay. (D) Apoptosis of Tu212 cells. (**p<0.01).
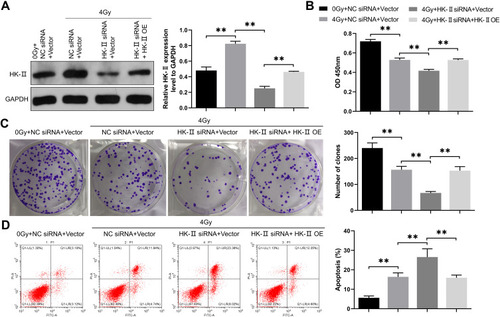
Figure 5 Results of HK-II siRNA treatment in vivo. Expression of (A) HK-II mRNA and (B) HK-II protein. (C) Tumor weight. (D) Tumor volume. (E) Apoptosis detected via the TUNEL assay. (*p<0.05, and **p<0.01).
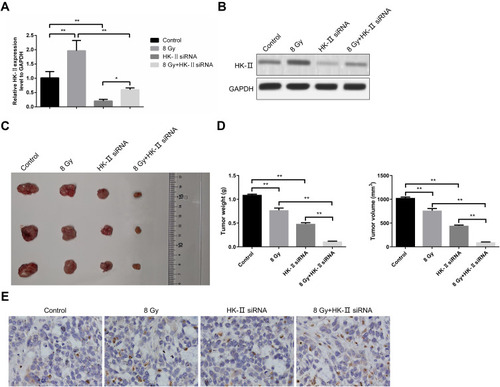
Figure 6 Effects of HK-II siRNA treatment on glycolysis in Tu212 cells treated with radiotherapy. (A) Glucose consumption. (B) Secretion of lactic acid. (C) Expression of PKM2, PFKP, and LD proteins in vitro. (D) Expression of PKM2, PFKP, and LD proteins in xenograft tumors. (*p<0.05, **p<0.01, #p<0.05, ##p<0.01, and ^^p<0.01).
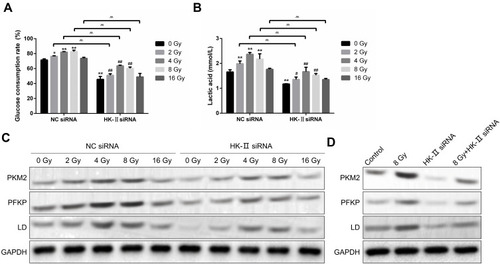
Figure 7 Effects of HK-II siRNA treatment on the TCA cycle in Tu212 cells treated with radiotherapy. (A) Oxygen consumption rate. (B) ATP content. (C) Expression of PDH and CS proteins in vitro. (D) Expression of PDH and CS proteins in xenograft tumors. (**p<0.01, ##p<0.01, and ^^compare in pair, ^compare in pairs).
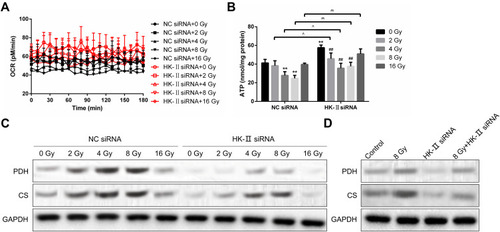
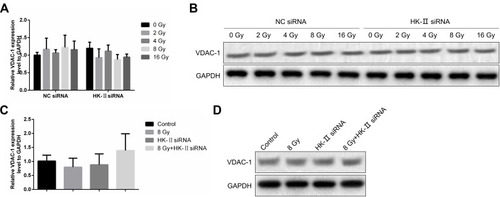
Figure 8 Effects of HK-II siRNA treatment on the expression of HK-II and VDAC-1 mRNA. (A) VDAC-1 mRNA expression in vitro. (B) VDAC-1 protein expression in vitro. (C) VDAC-1 mRNA expression in vivo. (D) VDAC-1 protein expression in vivo.