Figures & data
Figure 1 PPI network and enrichment analysis of pyroptosis-related genes.
Notes: (A) PPI network of pyroptosis-related genes based on the string database; (B) GO analysis of pyroptosis-related genes (MF); (C) GO analysis of pyroptosis-related genes (BP); (D) GO analysis of pyroptosis-related genes (CC); (E) KEGG analysis of pyroptosis-related genes.
Abbreviations: PPI, protein–protein interaction; GO, gene oncology; KEGG, Kyoto Encyclopedia of Genes and Genomes.
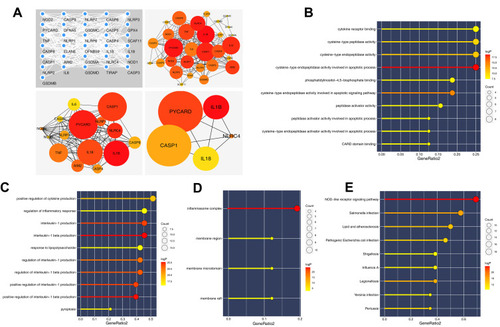
Figure 2 Construction and validation of prognosis model.
Notes: (A) LASSO algorithm was used to construct a prognosis model; (B) seven pyroptosis-related lncRNAs identified by multivariate cox analysis; (C) the training cohort of prognosis model; (D) the validation cohort of prognosis model.
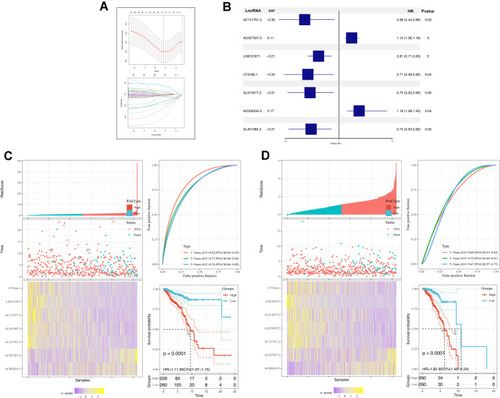
Figure 3 The independence of prognosis model and the prognosis association of model lncRNAs.
Notes: (A) Univariate analysis of riskscore and clinical features; (B) multivariate analysis of riskscore and clinical features; (C–I) Kaplan-Meier of seven model lncRNAs, AL513477.2, LINC01871, U73166.1, AL451085.2, AC005034.5, AC027307.2 and AC121761.2.
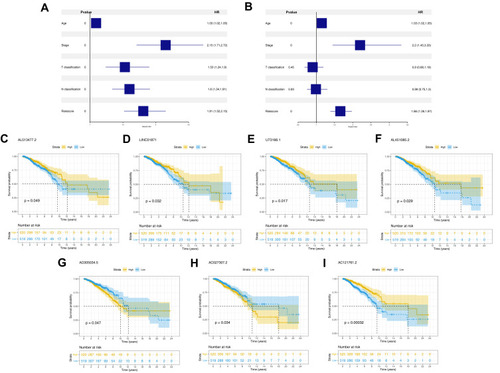
Figure 4 Clinical correlation of prognosis model and model lncRNAs.
Notes: (A) The correlation between age and risk score; (B) the correlation between T classification and risk score; (C) the correlation between N classification and risk score; (D) the correlation between clinical stage and risk score; (E) the correlation between age and model lncRNAs; (F) the correlation between T classification and model lncRNAs; (G) the correlation between N classification and model lncRNAs; (H) the correlation between clinical stage and model lncRNAs.
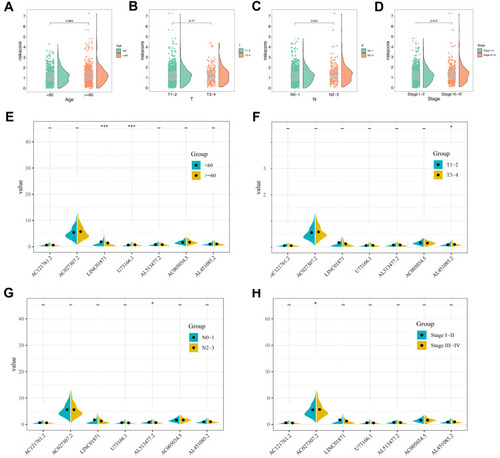
Figure 5 GSEA analysis of prognosis model.
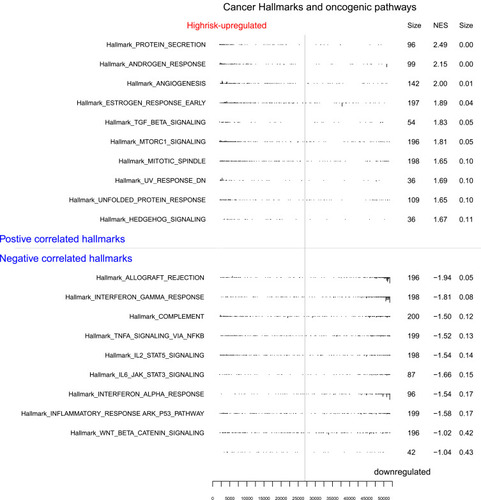
Figure 6 Immune infiltration in tumor microenvironment.
Notes: (A) ssGSEA algorithm quantified 22 immune cells; (B) the difference of immune cells between high- and low-risk group; (C) the correction between CD8+ T cells and risk score; (D) the correction between cytotoxic cells and risk score; (E) the correction between T helper cells and risk score; (F) the correction between Tgd and risk score; (G) the correction between Th2 cells and risk score.
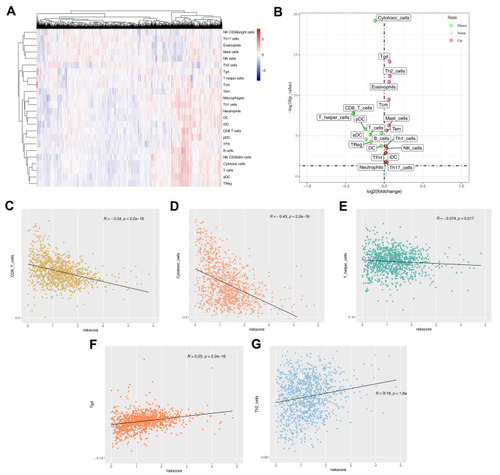
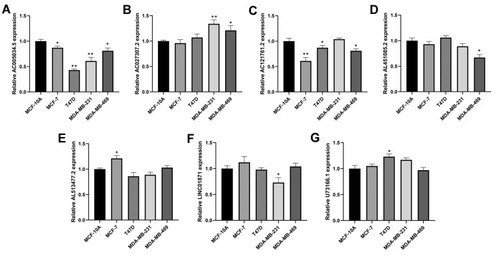
Figure 7 The qRT-PCR result of seven lncRNAs in four breast cancer and normal breast epithelial cell lines.
Notes: (A) qRT-PCR result of AC005034.5; (B) qRT-PCR result of AC027307.2; (C) qRT-PCR result of AC121761.2; (D) qRT-PCR result of AL451085.2; (E) qRT-PCR result of AL513477.2; (F) qRT-PCR result of LINC01871; (G) qRT-PCR result of U73166.1. *P < 0.05, **P < 0.01.