Figures & data
Figure 1 C5aR1 was expressed in both 786-O and ACHN cells. The expression of C5aR1 in 786-O and ACHN cells was examined by RT-PCR (A), Western blotting (B) and immunofluorescence analysis (C). Scale bar, 100µm.
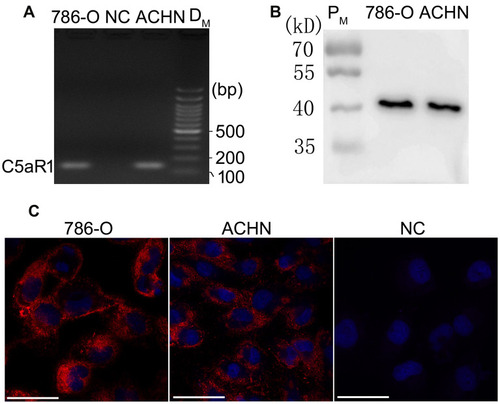
Figure 2 Addition of recombinant C5a to the cell culture medium had no significant influence on the proliferation, migration, or invasion of RCC cells. RCC cells (786-O and ACHN) were treated with 100 nM of recombinant C5a or not and the effects of C5a on cell proliferation, migration, and invasion were determined by CCK8, scratch healing and Matrigel invasion chamber methods. The influence of intracellular Ca2+ level was determined 5 minutes after addition of 100 nM recombinant C5a. All the experiments were repeated at least three times. (A and B) Results of proliferation analysis. (C–F) Results of invasion analysis. (G–J) Results of migration analysis. (K) Representative pictures under Fluorescence Microscope showing that addition of C5a obviously increased intracellular Ca2+ level of 786-O cells as represented by the increased fluorescence. Scale bar: 100 µm.
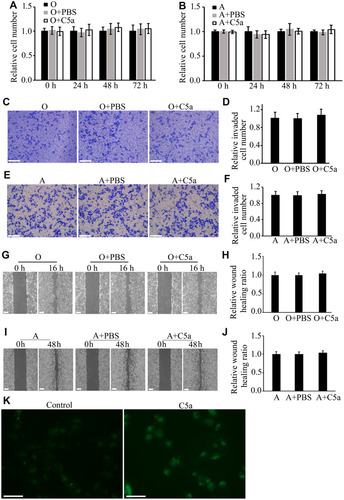
Figure 3 RCC cells were found to express carboxypeptidase M and carboxypeptidase D, but not carboxypeptidase N or carboxypeptydase Z.
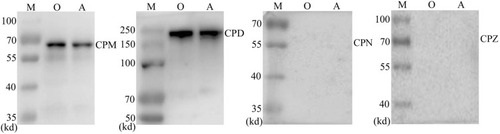
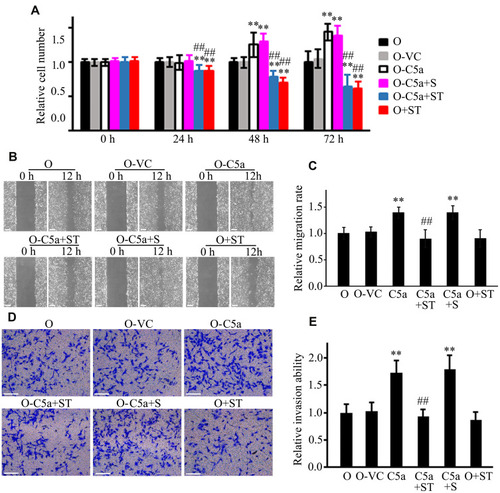
Figure 4 Secretory over-expression of C5a significantly increased the proliferation, migration, and invasion of RCC cells. Secretory over-expression of C5a in Lenti-C5a transfected cells was confirmed through measuring the C5a/C5a-des Arg level in the cell culture supernatant (A and B). The influence of secretory C5a over-expression on the cell proliferation (C and D), migration (E–H), and invasion (I–L) were determined by CCK8, scratch healing and Matrigel invasion chamber methods. All the experiments were repeated at least three times. **P<0.01 vs O group in (B, C, G and K), or vs A group in (A, D, H and L). ##P<0.01 vs O-C5a group in (C, G and K), or vs A-C5a group in (D, H and L). Scale bar: 100 µm.
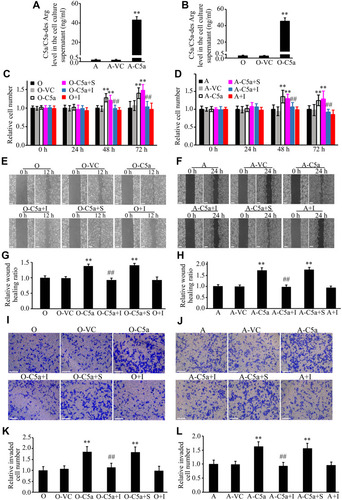
Figure 5 Secretory over-expression of C5a significantly increased the growth of transgrafted tumors in nude mice. (A) Representative pictures of the mice with tumor and the tumor isolated. (B) Results of statistical analysis of the tumor size and weight. **P<0.01 vs A or O group.
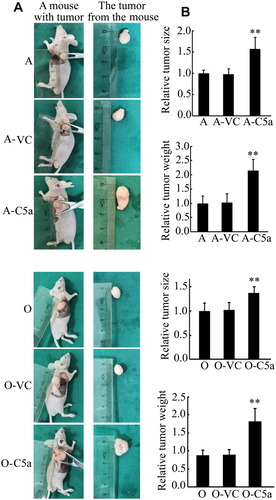
Figure 6 Secretory over-expression of C5a significantly increased the expression and activation of JNK/STAT3 pathway. The level of AKT (A), phosphorylated AKT (p-AKT, (B), ERK1/2 (C), phosphorylated ERK1/2 (p-ERK1/2, (D), p38 (E), phosphorylated p38 (p-p38, (F), STAT3 (G), phosphorylated STAT3 (p-STAT3, (H) and phosphorylated JNK (p-SAPK/JNK, (I) were measured by Western blot method. All the experiments were repeated three times. **P<0.01 vs 786-O group in (G, H and I).
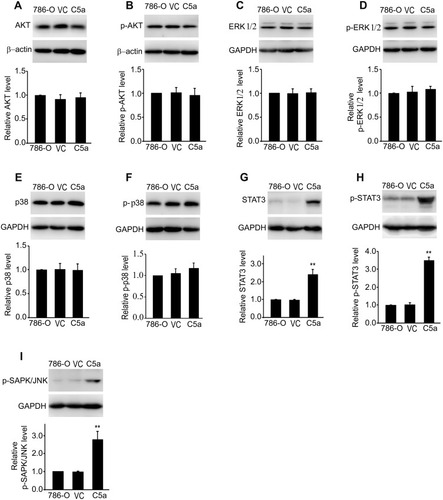
Figure 7 Inhibition of STAT3 blocked the effect of secretory C5a over-expression on the proliferation, migration, and invasion of RCC cells. The STAT3 specific inhibitor Stattic (20 μM) was used in the assay. The influence of Stattic on cellular proliferation (A), migration (B and C), and invasion (D and E) of untransfected 786-O and secretory C5a over-expression 786-O cells were analyzed by using CCK8, scratch healing and Matrigel invasion chamber methods. All the experiments were repeated at least three times. **P<0.01 vs O group. ##P<0.01 vs O-C5a group. Scale bar: 100 µm.