
Figures & data
Figure 1 Study workflow diagram of patient selection.
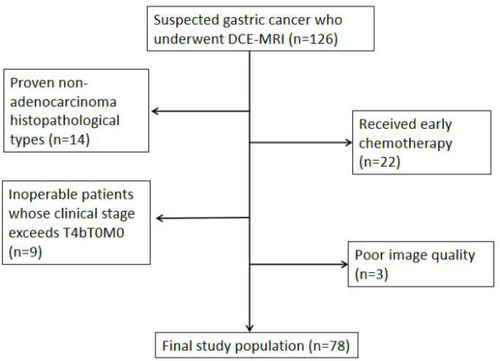
Figure 2 Male, 63 years old. The pathological diagnosis is intramucosal adenocarcinoma. The lesion invades the submucosa of the lesser curvature of stomach and is determined to be T1 stage. (A) ROI was manually drawn on whole lesions in late arterial phase. Corresponding parametric maps of Ktrans (B), Kep (C) and Ve (D) are created automatically. The corresponding mean values of Ktrans, Kep and Ve are 0.587 /min, 0.491 /min and 0.970, respectively. The histogram of tumor (E) demonstrates that the skewness, kurtosis and entropy are -0.899, 0.207 and 2.807, respectively.
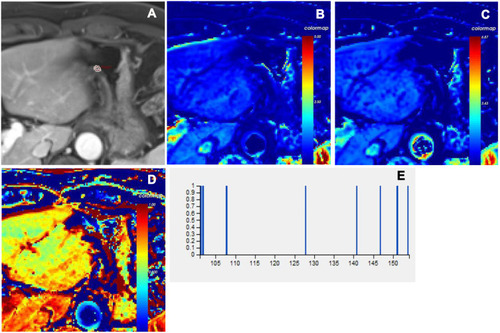
Figure 3 Male, 65 years old. The pathological diagnosis is poorly differentiated adenocarcinoma. The lesion invades the muscular layer of the cardiac wall and is determined to be T2 stage. (A) ROI was manually drawn on whole lesions in late arterial phase. Corresponding parametric maps of Ktrans (B), Kep (C) and Ve (D) are created automatically. The corresponding mean values of Ktrans, Kep and Ve are 0.570 /min, 1.418 /min and 0.402, respectively. The histogram of tumor (E) demonstrates that the skewness, kurtosis and entropy are 0.315, 0.147 and 5.595, respectively.
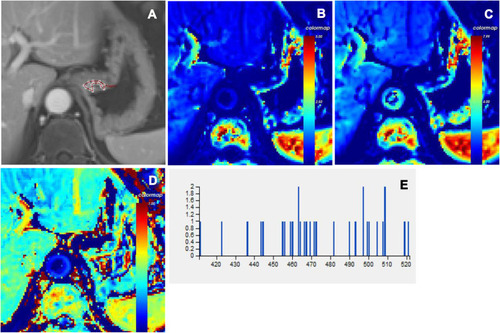
Figure 4 Female, 57 years old. The pathological diagnosis is poorly differentiated adenocarcinoma. The lesion invades the subserosa of the lesser curvature of the stomach and is determined to be T3 stage. (A) ROI was manually drawn on whole lesions in late arterial phase. Corresponding parametric maps of Ktrans (B), Kep (C) and Ve (D) are created automatically. The corresponding mean values of Ktrans, Kep and Ve are 0.818 /min, 1.298 /min and 0.551, respectively. The histogram of tumor (E) demonstrates that the skewness, kurtosis and entropy are -0.030, 0.139 and 6.003, respectively.
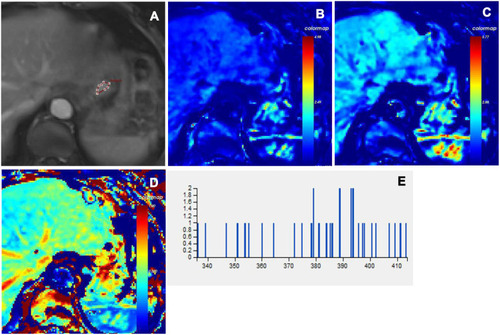
Figure 5 Male, 51 years old. The pathological diagnosis is adenocarcinoma. The lesion invades the serosal layer of the lesser curvature of the stomach and is determined to be T4a stage. (A) ROI was manually drawn on whole lesions in late arterial phase. Corresponding parametric maps of Ktrans (B), Kep (C) and Ve (D) are created automatically. The corresponding mean values of Ktrans, Kep and Ve are 0.159 /min, 0.117 /min and 0.327, respectively. The histogram of tumor (E) demonstrates that the skewness, kurtosis and entropy are 0.012, -0.142 and 6.104, respectively.
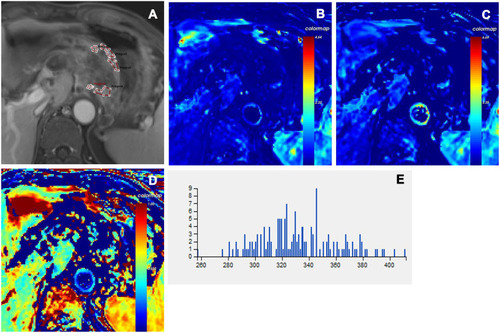
Table 1 The Clinicopathological Characteristics of Gastric Cancer
Table 2 The Consistency Analysis of Quantitative DCE Parameters and Histogram Metrics Results Measured by Two Radiologists
Table 3 Quantitative DCE Parameters to Evaluate T and N Staging
Table 4 Histogram Metrics to Evaluate T and N Staging
Table 5 Diagnostic Performance of Whole Tumor Histogram Analysis Parameters Derived from DCE-MRI for Discriminating T and N Staging