Figures & data
Table 1 The Sequences of the Primers in This Study
Figure 1 KPNA2 was selected to be a potential effector in NPC. (A) The common genes between the target genes list of miR-3940-3p and the DEGs in NPC by GSE12452 microarray analysis. Selection criteria: adjusted P<0.05, logFC>1. (B–F) The overall survival analysis results of the five genes in head and neck squamous carcinoma. The high expression group and low expression group were divided according to the mean of gene expression in head and neck squamous carcinoma samples. Data obtained from kmplotter database.
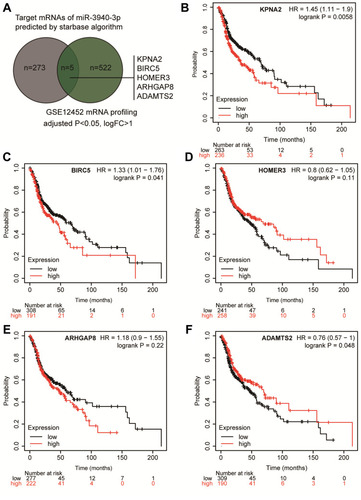
Figure 2 BBOX1-AS1 silence inhibits proliferation and triggers apoptosis in NPC cells in vitro. (A) The expression of BBOX1-AS1 in NPC tissues was analyzed by RT-PCR. (B) The expression of BBOX1-AS1 in various NPC cell lines was analyzed by RT-PCR. (C) 6–10B and C666-1 cells were transfected with shRNA1 and shRNA2 lentiviral target BBOX1-AS1. RT-qPCR was performed to examine the expression of BBOX1-AS1. (D) The proliferation ability of transfected cells was researched by CCK8 assay. (E) EdU assay presented the proliferation ability of transfected cells. * P<0.05,**P<0.001 vs sh-NC.
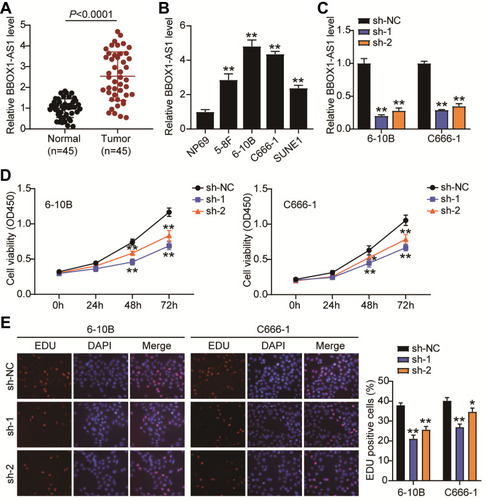
Figure 3 BBOX1-AS1 silence inhibits migration and invasion in NPC cells in vitro. (A) Effects of BBOX1-AS1 silence on NPC cell migration in a scratch wound assay. (B) Effects of BBOX1-AS1 silence on NPC cell migration in a transwell migration assay. (C) Effects of BBOX1-AS1 silence on NPC cell invasion in a transwell invasion assay. **P<0.001 vs sh-NC.
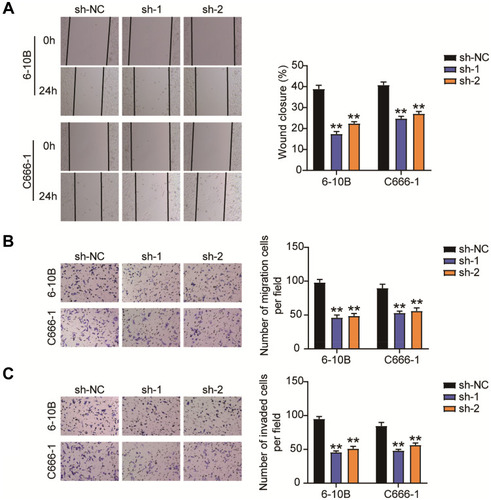
Figure 4 BBOX1-AS1 acted as a ceRNA by sponging miR-3940-3p. (A) The putative target sites between BBOX1-AS1and miR-3940-3p were shown. (B) Dual-luciferase analysis was preformed when NPC cells were co-transfected with BBOX1-AS1-wt and miR-3940-3p mimic or BBOX1-AS1-mut and miR-3940-3p mimic. The activity of luciferase was detected. (C) RNA pull-down was used to present the binding between BBOX1-AS1-mut and miR-3940-3p as fold enrichment. (D) RT-qPCR detecting miR-3940-3p expression in NPC tissues and normal tissues. (E) Pearson correlation between VEGF-B and ACR. (F) RT-qPCR detecting miR-3940-3p expression in NPC cells and NP69 cells. (G) miR-3940-3p expression level was detected by qRT-PCR when BBOX1-AS1was knocked down. **P<0.001, vs sh-NC; ΔΔP<0.001 vs inhibitor-NC; ##P<0.001 vs sh-1+inhibitor.
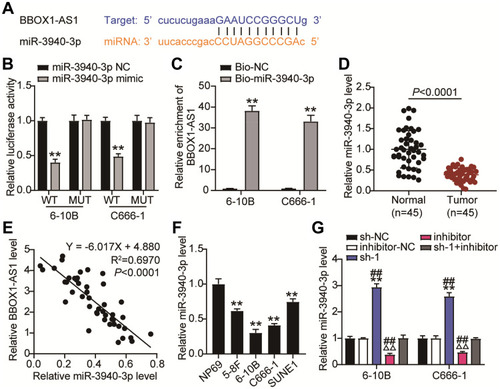
Figure 5 MiR-3940-3pp inhibitor restrains the ceRNA activity of BBOX1-AS1 on cell proliferation in NPC cells. (A) CCK8 assay examined the repressive impact of sh-BBOX1-AS1 on the proliferation of 6–10B and C666-1 cells by interact with miR-3940-3p. (B) Edu proliferation assay examined the repressive impact of sh-BBOX1-AS1 on the proliferation of 6–10B and C666-1 cells by interact with miR-3940-3pp. * P<0.05,** P<0.001, vs sh-NC; ΔP<0.05, ΔΔP<0.001 vs inhibitor-NC; ## P<0.001 vs sh-1+inhibitor.
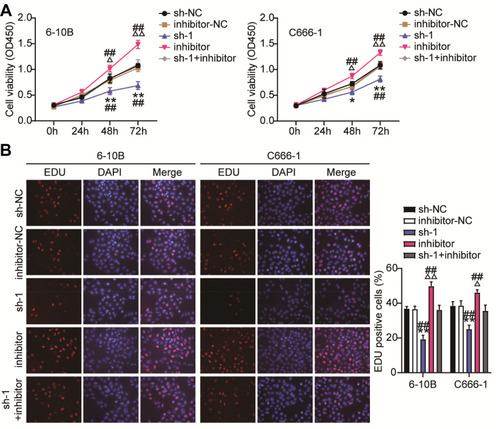
Figure 6 MiR-3940-3p inhibitor restrains the ceRNA activity of BBOX1-AS1 on cell migration and, invasion in NPC. NPC cells were co-transfected with miR-3940-3p mimic, mimic NC or sh-BBOX1-AS1 and shRNA NC. (A–C) Wound healing and transwell assays manifested the hampered capacity of migration in 6–10B and C666-1 cells in face of down-regulation of BBOX1-AS1 was abolished by addition of miR-3940-3p inhibitor. Relative wound width in c was calculated using the relative value of wound widths at 24 h to that at 0 h. ** P<0.001, vs sh-NC; ΔΔP<0.001 vs inhibitor-NC; ## P<0.001 vs sh-1+inhibitor.
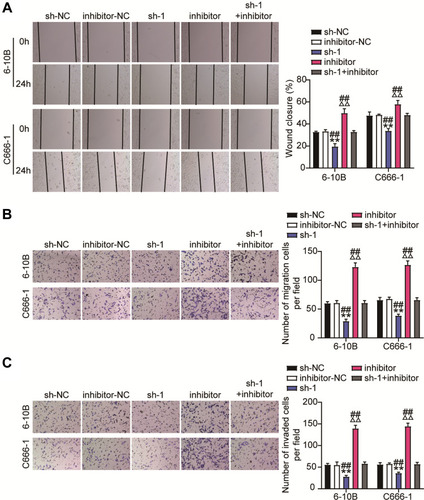
Figure 7 KPNA2 is a direct target of miR-3940-3p. (A) The potential interaction between miR-3940-3p and putative binding sites in the KPNA2. 3′-UTR. (B) Luciferase activities were measured in NPC cells co-transfected with luciferase reporter containing KPNA2 and the miR-3940-3p mimics or NC, or mutant. Data are presented as the relative ratio of renilla luciferase activity and firefly luciferase activity. (C) KPNA2 directly binding to miR-3940-3p. 6–10B and C666-1 cells were transfected with biotin-tagged miR-Ctrl (Bio-miR-Ctrl) or biotin-tagged miR-3940-3p (Bio-miR-3940-3p). Forty-eight hours after transfection, the cells were harvested for a biotin-based pull-down assay. KPNA2 expression levels were analyzed by qRT-PCR. (D) Relative KPNA2 mRNA expression was determined by 45 NPC tissues and corresponding normal tissues. (E) Pearson correlation between KPNA2 and miR-3940-3p (n = 45). (F) Relative KPNA2 mRNA expression was determined by qRT-PCR in NPC cells and NP69 cells. (G and H) RT-qPCR (G) and Western blotting. (H) Detecting relative KPNA2 mRNA expression in 6–10B and C666-1 cells after co-transfection with si-KPNA2 and miR-3940-3p inhibitor, their NC. **P<0.001 vs.sh-NC;ΔΔP<0.001 vs inhibitor-NC; ##P<0.001, vs sh-KPNA2+inhibitor.
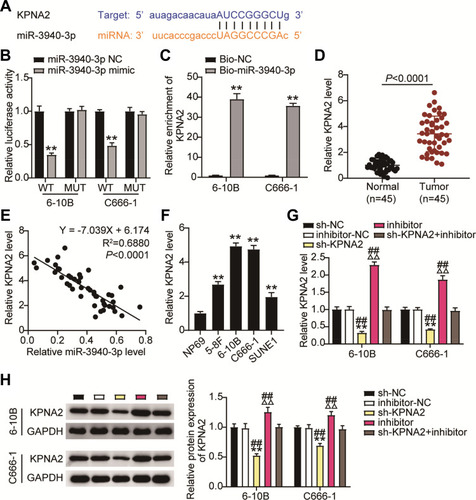
Figure 8 KPNA2 silence reduces NPC cell proliferation by regulated miR-3940-3p inhibitor. CCK8 (A) and EdU incorporation (B) assays showed that KPNA2 inhibited 6–10B and C666-1 cell proliferation which was rescued by miR-3940-3p inhibitor. *P<0.05, **P<0.001 vs.sh-NC; ΔΔP<0.001 vs inhibitor-NC; #P<0. 05, ##P<0.001, vs sh-KPNA2+inhibitor.
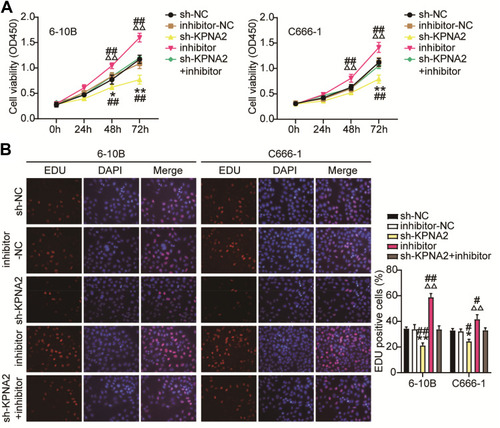
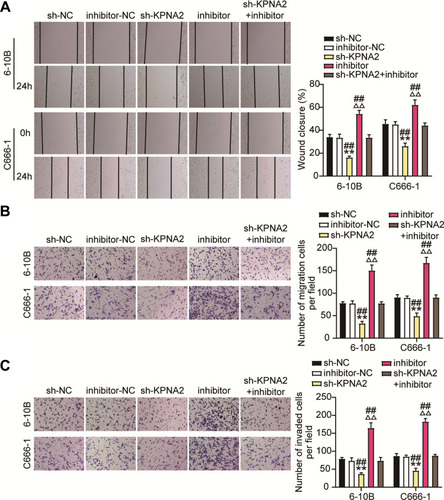
Figure 9 KPNA2 silence reduces NPC cell migration and invasion by regulated miR-3940-3p inhibitor. (A) Wound-healing and migration assays showed that silencing of KPNA2 suppressed migration in 6–10B and C666-1 cells, which was abated by miR-3940-3p knockdown. (B and C) Transwell migration and invasion assay showed that KPNA2 silence inhibited 6–10B and C666-1 cell migration and invasion by regulating miR-3940-3p inhibitor. n = 5 independent experiments. **P<0.001 vs.sh-NC; ΔΔP<0.001 vs inhibitor-NC; ##P<0.001, vs sh-KPNA2+inhibitor.