Figures & data
Figure 1 SNHG1 is upregulated in exosomes derived from hypoxic breast cancer cells. MDA-MB-231 and MCF-7 cells were cultured for 24 h under hypoxia or normoxia. (A) Western blot analysis of HIF-1α level in MDA-MB-231 and MCF-7 cells. (B and C) RT-qPCR analysis of SNHG1 level in MDA-MB-231 and MCF-7 cells. (D and E) Identification of exosomes derived from MDA-MB-231 and MCF-7 cells by TEM and NTA analysis. Exosome was indicated by the red arrow. (F and G) RT-qPCR analysis of SNHG1 level in exosomes derived from MDA-MB-231 and MCF-7 cells. Each experiment was repeated in triplicate (n=3). **P<0.01 vs Normal group.
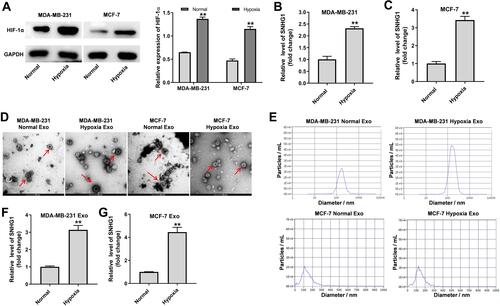
Figure 2 SNHG1 can be transferred from hypoxic breast cancer cells to HUVECs via exosomes. (A) Exosomes were isolated from breast cancer cells under hypoxia or normoxia. Then, PKH26-labeled exosomes were co-cultured with HUVECs for 48 h, and the fluorescence signal was observed by microscopy. (B) Exosomes were isolated from breast cancer cells under hypoxia and normoxia. Then, RT-qPCR analysis of SNHG1 level in HUVECs co-cultured with indicated exosomes. **P<0.01; n = 3.
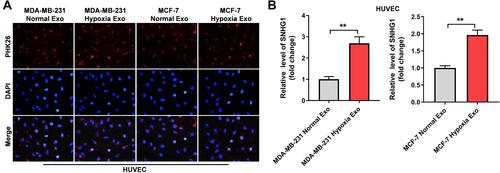
Figure 3 Exosomes derived from hypoxic breast cancer cells promoted the proliferation, migration and angiogenesis of HUVECs. Exosomes were isolated from breast cancer cells under hypoxia or normoxia. Then, HUVECs were co-cultured with indicated exosomes. (A) CCK-8 assay was applied to measure cell viability. (B) Wound healing assay was used to detect cell migration. (C) Transwell migration assay was used to detect cell migration. (D) Tube formation assay was applied to measure angiogenesis. **P<0.01; n = 3.
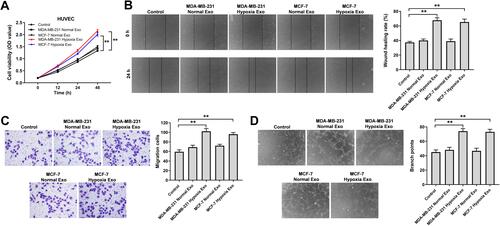
Figure 4 Exosomes derived from hypoxic breast cancer cells promotes the migration and angiogenesis of HUVECs. (A) RT-qPCR analysis of SNHG1 level in MDA-MB-231 cells transfected with siRNA-ctrl, SNHG1 siRNA1, siRNA2, siRNA3. (B) RT-qPCR analysis of SNHG1 level in HUVECs co-cultured with exosomes isolated from hypoxic MDA-MB-231 cells. (C) Wound healing assay was used to detect cell migration. (D) Transwell migration assay was used to detect cell migration. (E and F) Tube formation assay was applied to measure angiogenesis. **P<0.01.
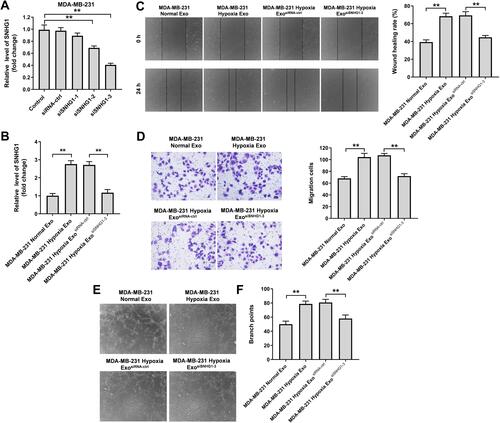
Figure 5 SNHG1 acts as the sponge of miR-216b-5p. (A) Schematic diagram of binding sites between SNHG1 and miR-216b-5p. (B) Luciferase activity analysis in 293T cells co-transfected with the SNHG1-wt/mut plasmids together with miR-216b-5p mimics. (C) HUVECs were treated with indicated exosomes, exosomes + mimics-ctrl or exosomes + miR-216b-5p mimics. Wound healing assay was used to detect cell migration. (D) Transwell migration assay was used to detect cell migration. **P<0.01; n = 3.
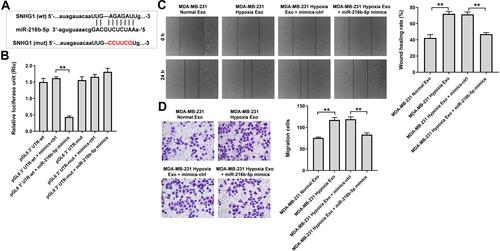
Figure 6 JAK2 is a direct binding target of miR-216b-5p. (A) Schematic diagram of binding sites between JAK2 and miR-216b-5p. (B) Luciferase activity analysis in 293T cells co-transfected with the JAK2-wt/mut plasmids together with miR-216b-5p mimics. (C–E) HUVECs were treated with indicated exosomes, exosomes + mimics-ctrl or exosomes + miR-216b-5p mimics. Western blot analysis of JAK2, p-STAT3 and STAT3 expressions in HUVECs. **P<0.01; n = 3.
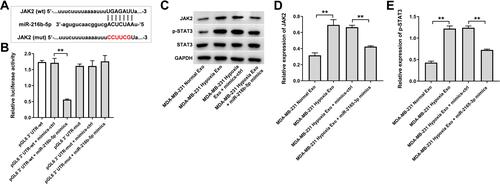
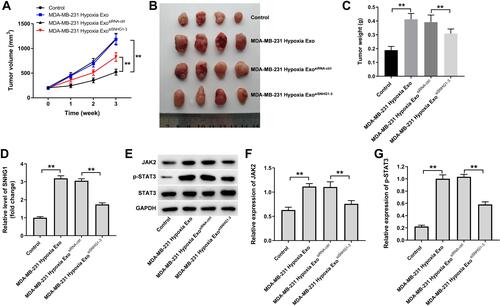
Figure 7 Exosomal SNHG1 derived from hypoxic breast cancer cells promotes the growth of breast cancer cells in vivo. (A–C) Tumor volume and tumor weight of xenograft tumors. (D) RT-qPCR analysis of SNHG1 level in tumor tissues. (E–G) Western blot analysis of JAK2, p-STAT3 and STAT3 expressions in tumor tissues. **P<0.01; n = 3.