
Figures & data
Figure 1 Pathological and immunohistochemical results. Tumor cells were arranged in nests, lobules or trabecular basaloid cells. Nuclear palisading was arranged in the peripheral region of tumor nests with hyaline-like materials identified (HE: A×200, B×400). Tumor cells were positive for P63 (C×400) and P40 (D×400) in immunohistochemical results.
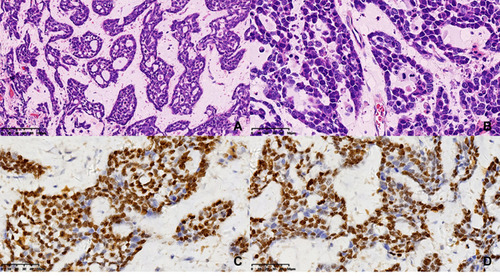
Figure 2 The histograms (A–F) and heatmap (G) of the serum lipids. According to the heatmap, positive correlations were found between HDL-C and APO A-I (r=0.798, P<0.001), TC and TG (r=0.495, P<0.001), TG and LDL-C (r=0.392, P=0.001), TG and APO B (r=0.430, P=0.001), TC and LDL-C (r=0.877, P<0.001), TC and APO B (r=0.855, P<0.001), LDL-C and APO B (r=0.910, P<0.001), respectively.
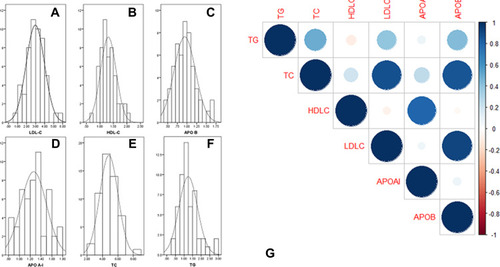
Table 1 Comparison of Baseline Clinical Characteristics Based on APO a-I in EBSCC
Figure 3 ROC curves analyses. ROC curves for serum LDL-C, HDL-C, APO B, APO A-I, TG and TC regarding RFS (A) and OS (B) regarding the best cut-off points.
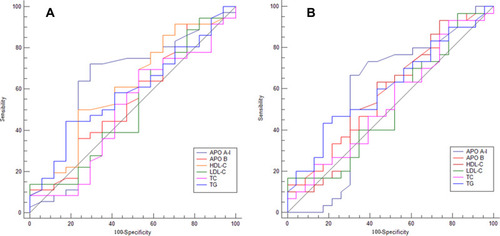
Table 2 Univariate and Multivariate Analyses of RFS in EBSCC Patients
Table 3 Univariate and Multivariate Analyses of OS in EBSCC Patients
Figure 4 RFS and OS analyses. Patients with lower levels of serum APO A-I were associated with worse RFS (16.1% vs 54.5%, P=0.006; (A) and OS (29.0% vs 63.6%, P=0.010; (B).
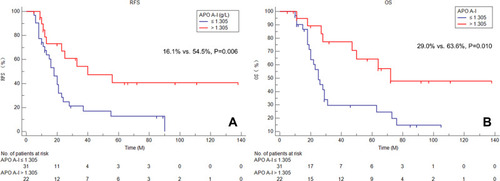
Figure 5 Nomogram analyses. Nomograms based on APO A-I for predicting the 1-, 3- and 5-year RFS (A) and OS (B).
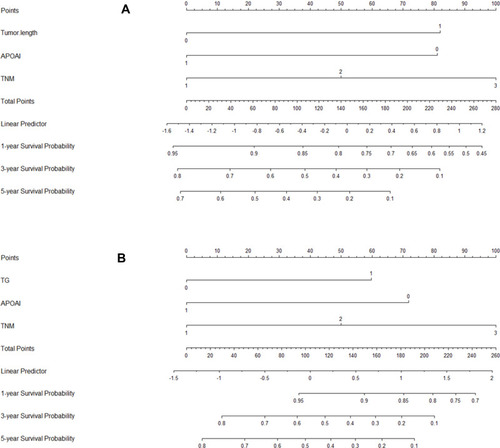
Figure 6 Nomogram established regarding RFS and OS prediction. The calibration curve presented an acceptable agreement for RFS (A–C) and OS (D–F). Time-dependent ROC curve analyses revealed that the nomogram (0.70, 0.81 and 0.88 for 1-, 3- and 5-year RFS prediction [G–I] and 0.72, 0.81 and 0.84 for 1-, 3- and 5-year OS prediction [J–L) was significantly higher than traditional TNM staging systems (0.63, 0.71 and 0.82 for 1-, 3- and 5-year RFS prediction and 0.57, 0.64 and 0.73 for 1-, 3- and 5-year OS prediction). The APO A-I-based nomogram model had higher overall net benefits than traditional TNM staging systems according to the decision curve analyses in RFS (M–O) and OS (P–R).
![Figure 6 Nomogram established regarding RFS and OS prediction. The calibration curve presented an acceptable agreement for RFS (A–C) and OS (D–F). Time-dependent ROC curve analyses revealed that the nomogram (0.70, 0.81 and 0.88 for 1-, 3- and 5-year RFS prediction [G–I] and 0.72, 0.81 and 0.84 for 1-, 3- and 5-year OS prediction [J–L) was significantly higher than traditional TNM staging systems (0.63, 0.71 and 0.82 for 1-, 3- and 5-year RFS prediction and 0.57, 0.64 and 0.73 for 1-, 3- and 5-year OS prediction). The APO A-I-based nomogram model had higher overall net benefits than traditional TNM staging systems according to the decision curve analyses in RFS (M–O) and OS (P–R).](/cms/asset/71ffab43-9256-44da-9fc9-af9b321a3e07/dcmr_a_12189906_f0006_c.jpg)