Figures & data
Table 1 Clinical Characteristics of the Patients According to LMR and Hemoglobin in the Training Group
Figure 1 Kaplan–Meier curves for OS and CSS stratified by LMR and hemoglobin in the training group. (A and C), LMR OS and CSS; (B and D), Hemoglobin OS and CSS.
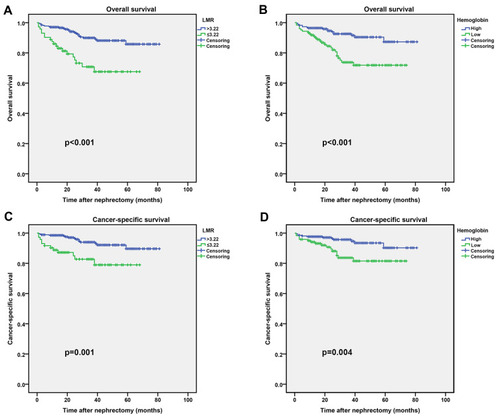
Table 2 Baseline Characteristics of the Patients According to SIRI in the Training Group
Figure 2 Kaplan–Meier curves for OS and CSS stratified by SIRI. (A and B), SIRI OS and CSS in the training group; (C and D), SIRI OS and CSS in the validation group.
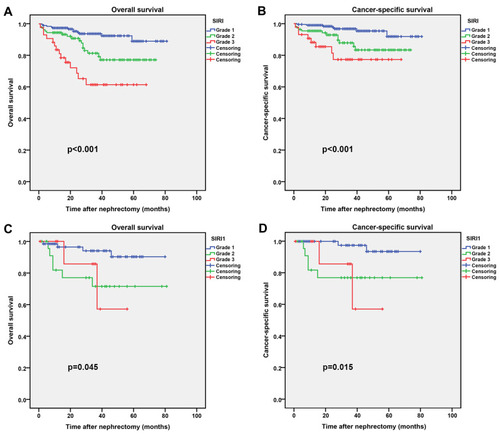
Table 3 Analysis of Predictive Accuracy Through the Evaluation of the Area Under the Curve (AUC)
Figure 3 Comparison of area under ROC curves for LMR, hemoglobin and SIRI in predicting OS and CSS. (A) OS ROC curves in the training group; (B) CSS ROC curves in the training group; (C) OS ROC curves in the validation group; (D) CSS ROC curves in the validation group.
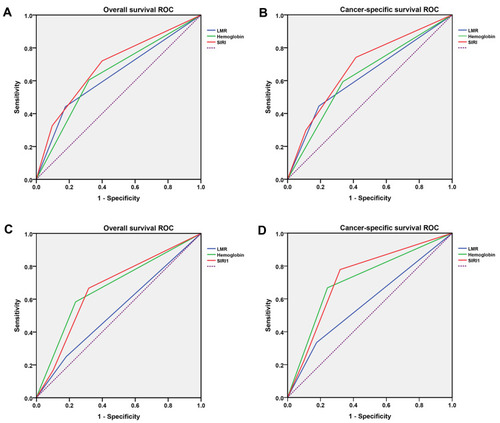
Table 4 Multivariate Analyses of Factors Associated with Overall Survival (OS) and Cancer-Specific Survival (CSS) in the Training Group
Figure 4 The nomogram predicting 1-year and 3-year OS and CSS rate of RCC patients the training cohort. (A) OS nomogram; (B) CSS nomogram.
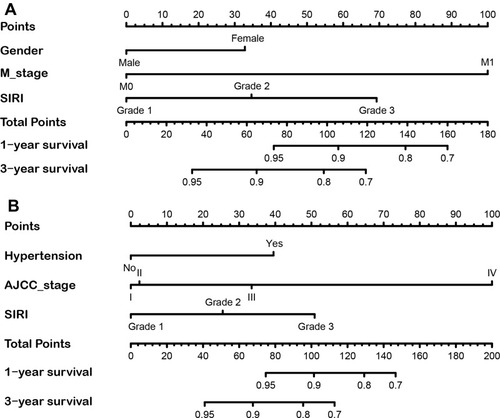
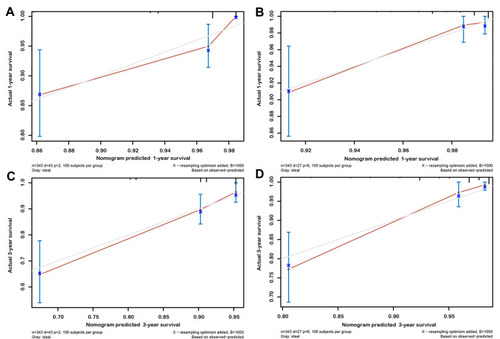
Figure 5 Calibration plot of the nomogram for predicting 1-year and 3-year OS and CSS in training cohort. (A) 1-year OS; (B) 1-year CSS; (C) 3-year OS; (D) 3-year CSS.