Figures & data
Figure 1 (A) Abdominal dynamic CT scan were performed on the three groups before and 7 days after operation (n = 4). (B) Tumor growth rate of each group (n = 4). (C) The number of intrahepatic metastases 7 days after operation (n = 4). *P < 0.05, **P < 0.01, ***P < 0.001.
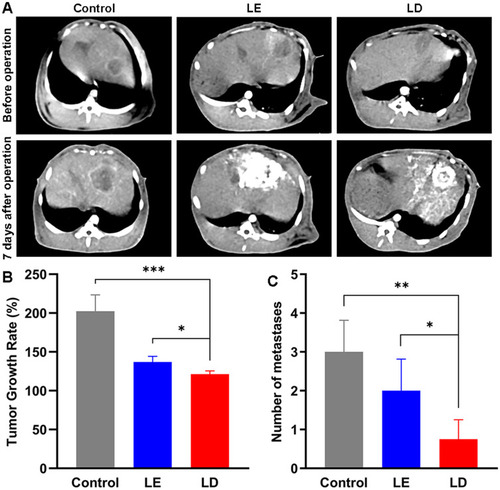
Figure 2 (A) Representative hematoxylin-eosin staining. Scale bar = 100 μm. (B) Tumor necrosis rate of each group. *P < 0.05.
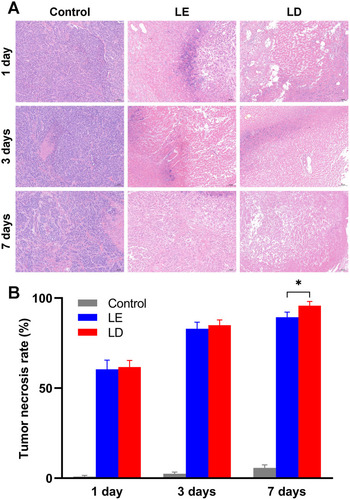
Figure 3 (A) Immunofluorescence of CD31. Nucleus (blue area) and positive expression of CD31 (red area). Scale bar = 50 μm. (B) The percentages of CD31-positive area in VX2 tumor tissue. ***P < 0.001.
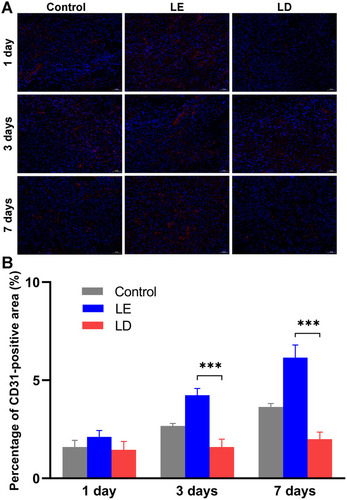
Figure 4 (A) Immunohistochemical staining for CD8 in the VX2 tumor and adjacent liver tissue 1 day, 3 days and 7 days after treatment. (B) Quantification of CD8-positive T-lymphocytes per high magnification (200×). *P < 0.05, **P < 0.01, ***P < 0.001.
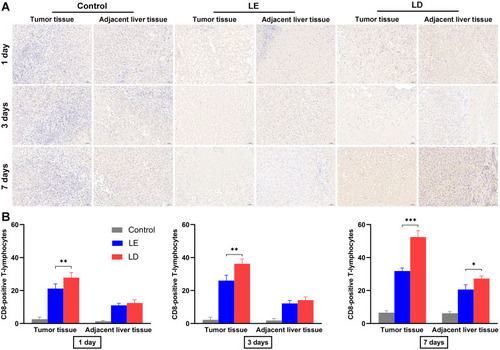
Figure 5 Levels of IL-6 (A), TNF-α (B) and IFN-γ (C) in serum.
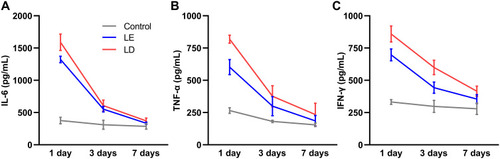
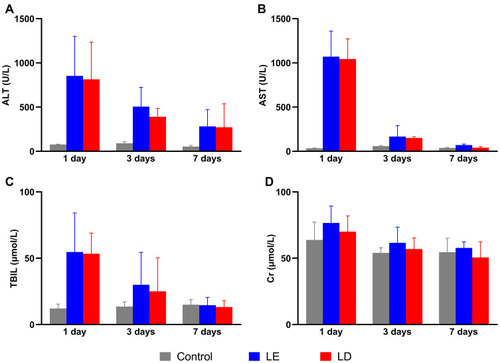
Figure 6 Levels of ALT (A), AST (B), TBIL (C) and Cr (D) in each group.