
Figures & data
Figure 1 (A) PGI levels in controls and BGD and first-diagnosis GC patients; (B) PGII levels in controls and BGD and first-diagnosis GC patients; (C) PGI/PGII ratio in controls and BGD and first-diagnosis GC patients; (D) sTim-3 levels in controls and BGD and first-diagnosis GC patients; (E) sTim-3 levels in first-diagnosis GC patients (stage I, stage II, stage III, and stage IV); (F) sTim-3 levels in controls, recurrence group after GC surgery, and no recurrence group after GC surgery. *P < 0.05; **P < 0.01; ***P < 0.001; ****P < 0.0001.
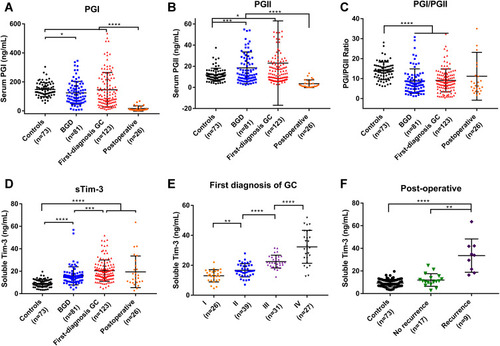
Table 1 Serum Indices of Control, BGD, First-Diagnosis GC, and Post-Operative GC Groups
Table 2 Positive Detection Rates of PGI, PGII, and sTim-3 Levels and the PGI/PGII Ratio in the Control, BGD, and First-Diagnosis GC Groups
Table 3 Independent Diagnostic Value of Serum Markers in BGD and First-Diagnosis GC
Figure 2 Independent diagnostic value of serum sTim-3, PGI, and PGII levels and the PGI/PGII ratio in BGD and first-diagnosis GC analyzed by ROC. (A) ROC curves of serum marker levels between the controls and BGD patients; (B) ROC curves of serum marker levels between the controls and first-diagnosis GC patients; (C) ROC curves of serum marker levels between BGD and first-diagnosis GC patients.
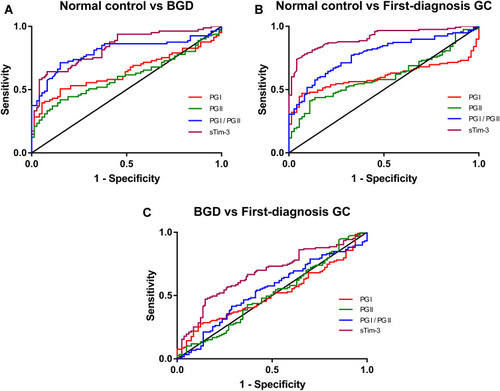
Table 4 Diagnostic Value of Serum Marker Combinations in BGD and First-Diagnosis GC
Figure 3 Independent diagnostic value of serum sTim-3, PGI, and PGII levels and the PGI/PGII ratio in BGD and first-diagnosis GC patients was analyzed by ROC analysis. (A) ROC curves of serum marker levels between the controls and BGD patients; (B) ROC curves of serum marker levels between the control and first-diagnosis GC patients; (C) ROC curves of serum marker levels between BGD and first-diagnosis GC patients.
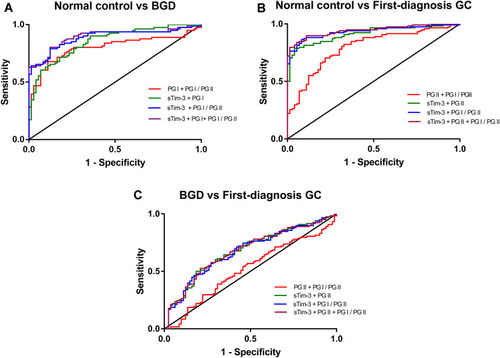
Table 5 Positive Detection Rate of the New Cut-Off Value of Combined Detection in BGD and GC