Figures & data
Table 1 Baseline Characteristics of Patients
Figure 1 Gut microbiota diversity in patients (n=31). (A) Species accumulation curves became flatter as the sample size increased, indicating that the sample size of this study is adequate. (B) The estimated OTUs richness was significantly decreased from the non-diarrhea group (n=11) to the diarrhea group (n=20). (C) The estimated OTUs richness was significantly decreased in the severe group (n=13). (D) Rank-abundance distribution curves analysis showed that the relative abundance of the diarrhea group was lower than that of the non-diarrhea group. (E) The relative abundance of the severe group decreased compared with the mild group. (F) Gut microbial diversity in the diarrhea group was lower than that in the non-diarrhea group by Shannon analysis. (G) Gut microbial diversity was significantly higher in the severe group than that of in the mild group (p=0.048). (H) PCoA analysis indicated a symmetrical distribution of fecal microbial community among all the samples.
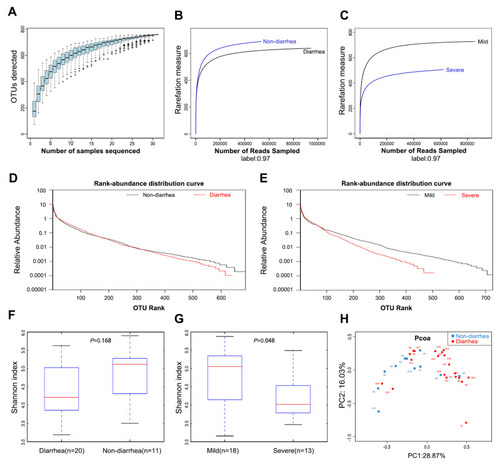
Figure 2 The composition of the microbial community and the predominant classes in two groups. (A) Composition of fecal microbiota at the phylum level and genus level. (B) The predominant classes of microbes in two groups at phylum level. The part of the abundance less than 1% was merged into others when plotting.
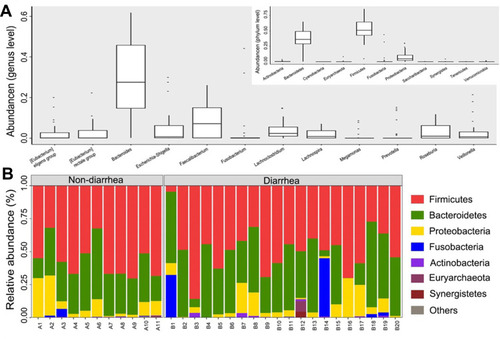
Figure 3 The change of gut microbiota in the diarrhea group. (A) Tenericutes significantly decreased in the diarrhea group (p=0.037). (B–J) Types of bacteria reduced in diarrhea group. (K) Less Actinobacteria was found in the severe group (p=0.041). The box presented 95% CIs; the line inside denotes the median, and the symbol “+” denotes the mean value.
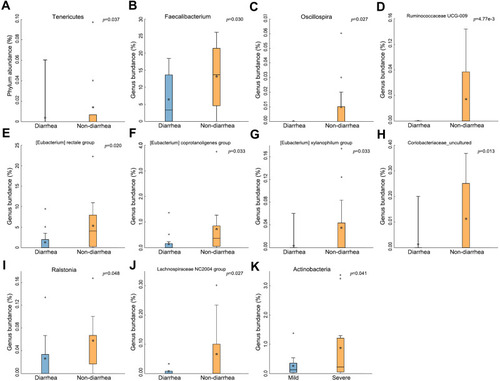
Figure 4 The change of bacteria displayed by LDA analysis. (A) Cladogram. The red and green nodes in the branches represented the microbiota that play an important role in the corresponding groups, respectively, while the yellow nodes represented the microbiota that do not play an important role in the two groups. (B) The LDA scores obtained by LDA analysis for the significant microbial communities in the two groups. The red and green regions indicated the abundance of different microbes.
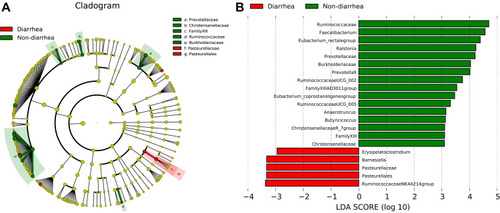
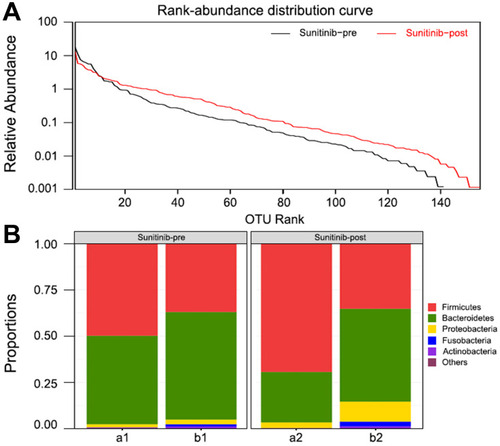
Figure 5 Bacteroides in patients with sunitinib. (A) Rank-abundance distribution curve. The bacterial diversity increased after sunitinib treatment. (B) Microbial community composition of patients before and after treatment. The abundance of Bacteroides was decreased in patients with sunitinib.