Figures & data
Figure 1 Volcano plot of DEcircRNAs, DEmiRNAs, and DEmRNAs. Volcano plot displayed 20 upregulated and 146 downregulated circRNAs (A), 109 upregulated and 124 downregulated miRNAs (B), 415 upregulated and 902 downregulated mRNAs (C). Red and blue indicate up-regulated and down-regulated genes respectively.
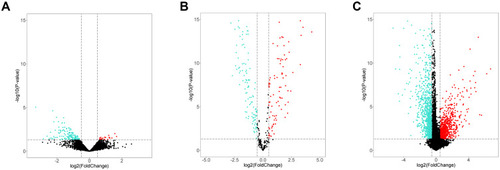
Figure 2 Four circular RNA (circRNA) and matched host genes. (A) Levels of hsa_circ_0035554, hsa_circ_0009034, hsa_circ_0007440 and hsa_circ_0003205 host genes. (B) Kaplan–Meier survival analysis on those 4 circRNAs host genes within OSA cases. (C) ROC curve of ANXA2, MAP3K5 and CTNNA1 for predicting 5-years overall survival of OSA patients. (D) Structural patterns of the four circRNAs.
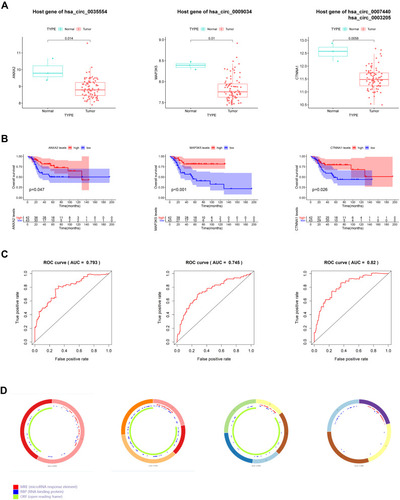
Figure 3 RT-qPCR validation of four circRNAs expression in OSA cells. The relative expression level of hsa_circ_0035554 (A), hsa_circ_0009034 (B), hsa_circ_0007440 (C) and hsa_circ_0003205 (D) in hFOB1.19, 143B, and MG63. Data were presented as mean ± SD of three number of replicates. *P<0.05 and **P<0.01.
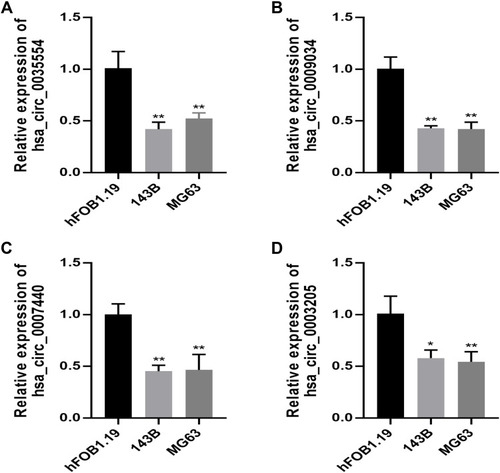
Figure 4 The circRNA-miRNA-mRNA regulatory network construction in OSA.
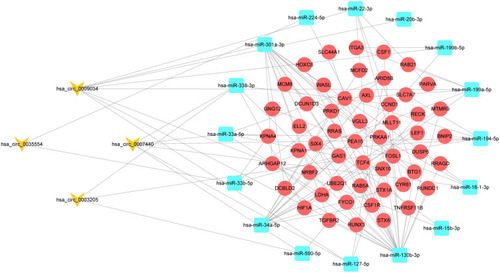
Figure 5 Functional Enrichment Analysis of DEmRNAs. GO analysis (A) KEGG pathway analysis (B) of up- and down-regulated genes. (C) PPI network for DEG. (D) 10 hub genes including CCND1, CAV1, CYR61, FOSL1, RAB5A, AXL, LEF1, RUNX3, HIF1A and WASL regulate DEGs in OSA.
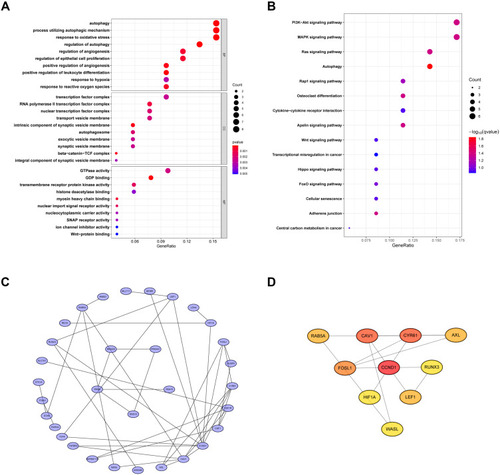
Figure 6 Construction of the ceRNA-based risk signature in training set. (A) LASSO coefficient profiles in training cohort. (B) A coefficient profile plot was generated against the log (lambda) sequence. Selection of the optimal parameter (lambda) in the LASSO model for training cohort. (C) Forest plot for the prognostic risk genes. (D) The survival status patients with OSA in training cohort. (E) The risk scores of patients with OSA in training cohort. (F) Kaplan-Meier survival analysis on low- and high-risk patients. (G) ROC curves for 1-, 3-, and 5-year survival. **P<0.01, and ***P<0.001.
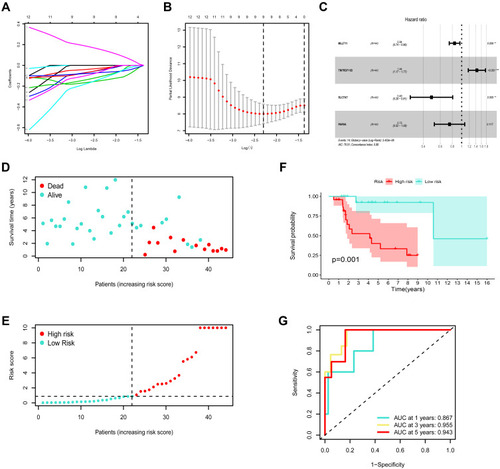
Figure 7 Risk model validation in both test set and entire set. (A) The survival status patients with OSA in test cohort. (B) The risk scores of patients with OSA in test cohort. (C) The survival status patients with OSA in entire cohort. (D) The risk scores of patients with OSA in entire cohort. Kaplan–Meier survival curves for OS of test set (E) and entire set (F) samples classified by risk scores. ROC analysis curves for the risk signature in both test set (G) and entire set (H).
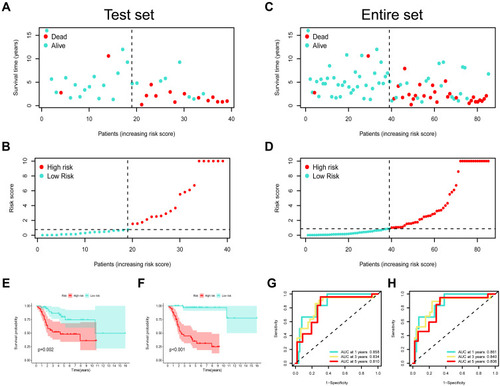
Figure 8 Nomogram according to risk score and clinical factors to predict overall survival of patients with OSA. Independent prognostic analysis by univariate (A) and multivariate Cox regression analyses (B). (C) The nomogram includes prognostic model and clinical factors. (D and E) The calibration curve was utilized to confirm the accuracy of predicting 3-, and 5-year OS.
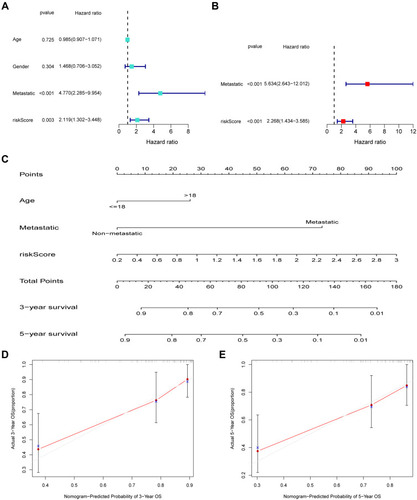
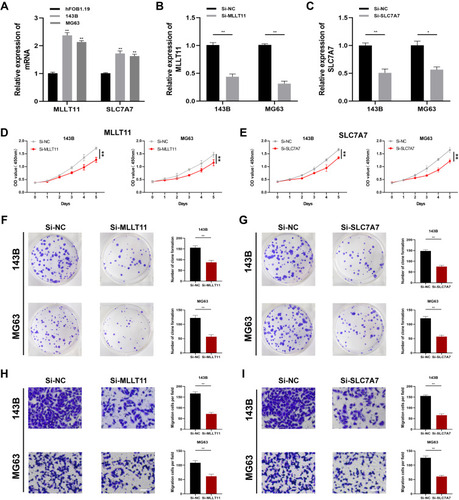
Figure 9 Expressions and effects of MLLT11 and SLC7A7 in OSA cells. (A) The expression levels of MLLT11 and SLC7A7 were measured through qPCR. Transfection efficiency of MLLT11 (B) and SLC7A7 (C) in 143B and MG63. MLLT11 inhibition reduced the proliferation of 143B and MG63 (D). SLC7A7 inhibition reduced the proliferation of 143B and MG63 (E). (F and G) Colony formation downregulated by Si-MLLT11 and Si-SLC7A7. (H and I) Ability of migration was inhibited by Si-MLLT11 and Si-SLC7A7. Data were presented as mean ± SD of three number of replicates. *P<0.05 and **P<0.01.