Figures & data
Table 1 Primers Used for Real‐Time PCR
Table 2 Association of AFAP1-AS1 Expression with Clinicopathologic Features in TCGA OSCC
Figure 1 AFAP1-AS1 was up-regulated in OSCC and indicated a worse prognosis. AFAP1-AS1 expression was significantly higher in OSCC based on TCGA-OSCC (A) and GSE84505 (B) datasets. The expression of AFAP1-AS1 in TCGA-OSCC is grouped by lymph node metastasis (C), pathological grades (D), and pathological stages (E). (F) Overall survival based on AFAP1-AS1 expression in TCGA-OSCC (cutoff=median). *P<0.05 and ****P<0.0001.
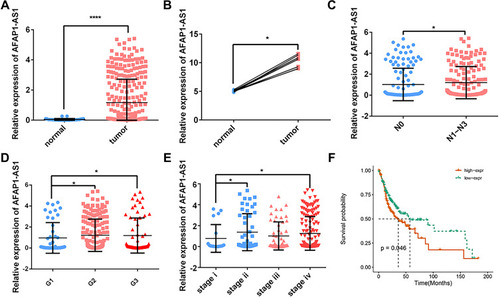
Figure 2 AFAP1-AS1 knockdown suppresses OSCC proliferation in vitro. (A) The expression of AFAP1-AS1 was dramatically decreased in Cal 27 by transfection with sh-AFAP1-AS1 lentivirus. CCK-8 (B) and colony formation assay (C and D) showed that AFAP1-AS1 knockdown inhibited Cal 27 cell proliferation in vitro. (E and F) The cell cycle was analyzed by flow cytometry. *P<0.05, **P<0.01, ***P<0.001; ****P<0.0001.
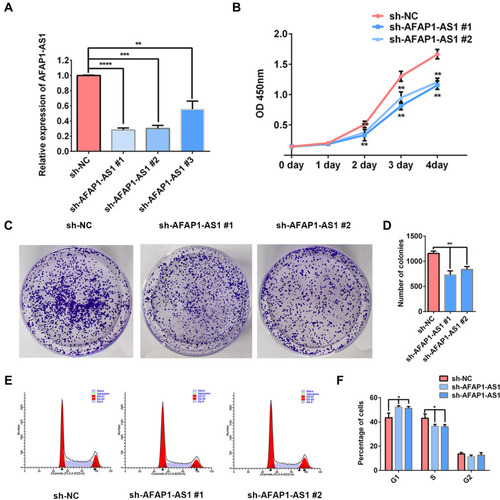
Figure 3 Bioinformatics analysis of RNA-seq results of sh-AFAP1-AS1 and sh-NC. (A and B) The heatmap and volcano plot showed the DEGs between Cal 27 sh-AFAP1-AS1 and sh-NC samples (C). Metascape bar graph exhibited the top 20 nonredundant GO enrichment clusters of the DEGs. (D) The bubble diagram showed the top 50 enriched KEGG pathways.
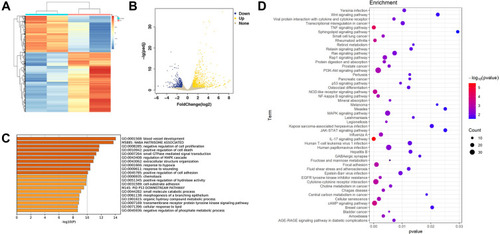
Figure 4 GSEA results indicated that the gene sets HALLMARK_MYC_TARGETS V1 and HALLMARK_MYC_TARGETS V2 were enriched in samples with relatively high expression of AFAP1-AS1. (A) Three independent GSEA datasets were evaluated. (B and C) The gene sets HALLMARK_MYC_TARGETS V1 and HALLMARK_MYC_TARGETS V2 were significantly enriched in TCGA-OSCC tumor samples compared to normal control samples. (D and E) The gene sets HALLMARK_MYC_TARGETS V1 and HALLMARK_MYC_TARGETS V2 were significantly enriched in TCGA-OSCC tumor samples with high expression of AFAP1-AS1. (F and G) The gene sets HALLMARK_MYC_TARGETS V1 and HALLMARK_MYC_TARGETS V2 were significantly enriched in the Cal 27 sh-NC group compared to the sh-AFAP1-AS1 group.
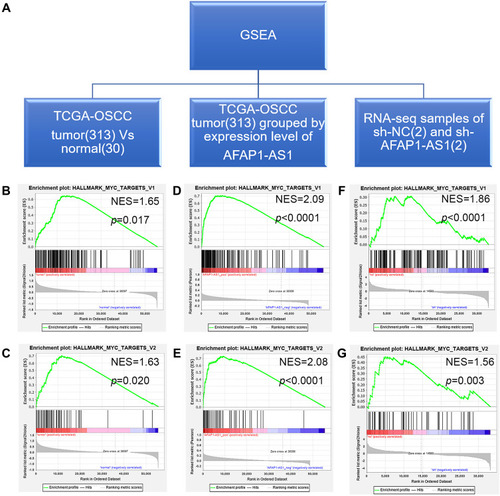
Figure 5 AFAP1-AS1 promotes OSCC proliferation by targeting CCNA2. (A) Bar graph showing the fold changes of 13 differentially expressed Myc target genes after AFAP1-AS1 knockdown. (B) PPI network of the 13 differential expressed genes. (C) Correlation analysis of AFAP1-AS1 and CCNA2 in OSCC based on TCGA-OSCC. (D) The high expression of the CCNA2 predicted poor prognosis in TCGA-OSCC. (E) qRT-PCR assays examined CCNA2 expression in Cal 27 cells after AFAP1-AS1 knockdown. (F and G) The expression of c-Myc, cyclin A2, and E2F2 was examined by Western blotting assay. (H and I) Three miRNAs were predicted to target both AFAP1-AS1 and CCNA2. *P<0.05; **P<0.01; and ***P<0.001.
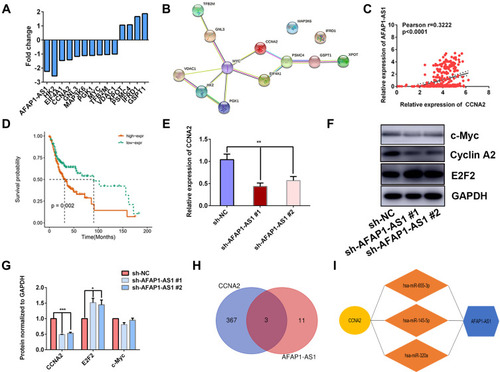
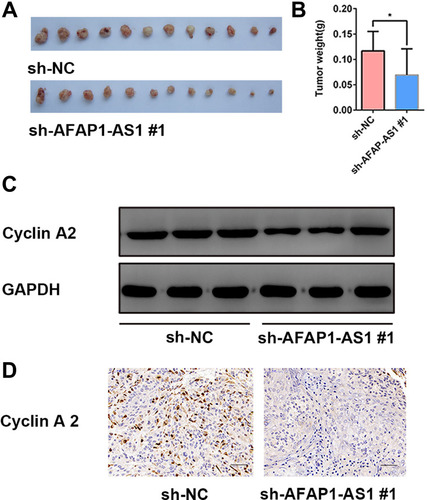
Figure 6 Knockdown of AFAP1-AS1 inhibited tumor growth and suppressed the expression of CCNA2 in vivo. (A and B) Tumor xenografts in the sh-AFAP1-AS1#1 group were significantly smaller than those in the sh-NC group. (C) Protein expression levels of cyclin A2 were determined by Western blotting of xenograft samples. (D) Representative IHC staining of cyclin A2 proteins in OSCC xenograft specimens. (×400). *P<0.05.