
Figures & data
Table 1 FAM83s Expression in Different Type of Ovarian Cancer and Normal Ovarian Tissues (Oncomine)
Figure 1 Transcriptional level of FAM83 family members in various types of cancer (ONCOMINE).
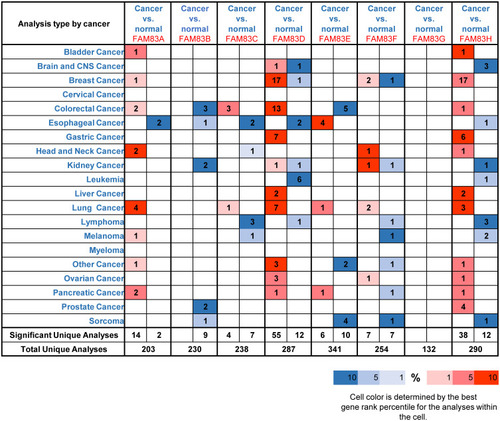
Figure 2 The mRNA expression levels of FAM83 family members in 426 ovarian cancer tissues and 88 normal ovary tissues (GEPIA) (A–H).
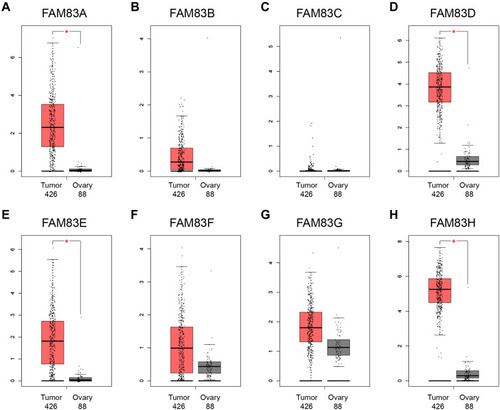
Figure 3 FAM83 family genes alterations in ovarian cancer (cBioportal).
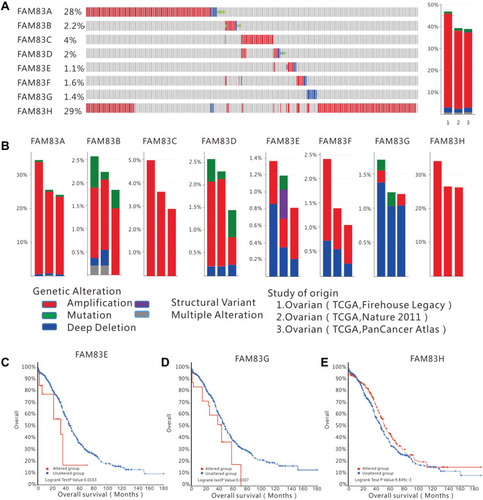
Figure 4 Prognostic value of FAM83s mRNA levels in patients with OC (OS in Kaplan–Meier plotter).
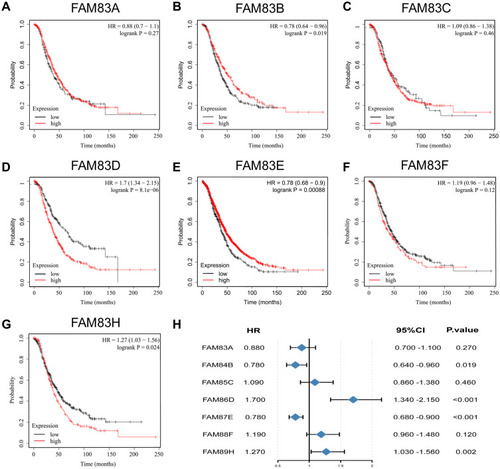
Figure 5 Prognostic value of FAM83s mRNA levels in patients with OC (PFS in Kaplan–Meier plotter).
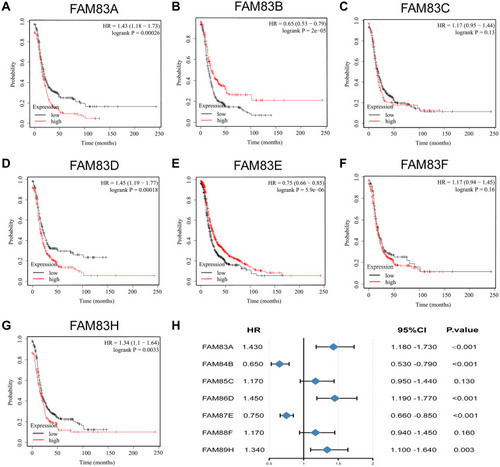
Table 2 The Prognostic Value of FAM83D and FAM83H in Different Subtypes
Figure 6 Functional enrichment analysis of FAM83D and FAM83H in ovarian cancer.
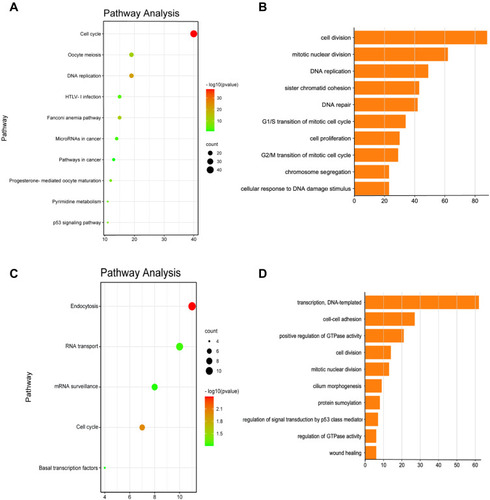
Figure 7 Co-expression analysis of FAM83D/H and cell cycle pathway-related genes.
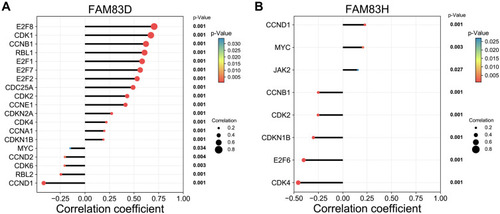
Figure 8 Correlation between FAM83D/H expression and immune infiltration.
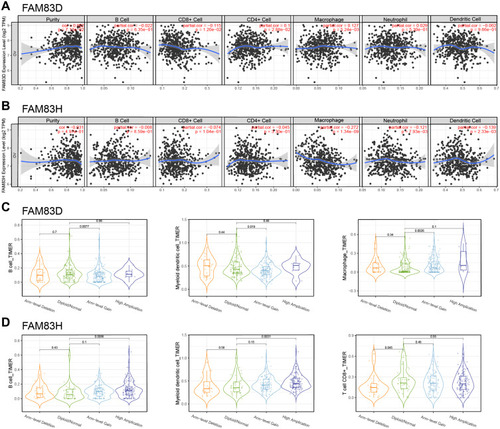
Figure 9 IHC analysis and clinicopathological analysis of FAM83H in OC.
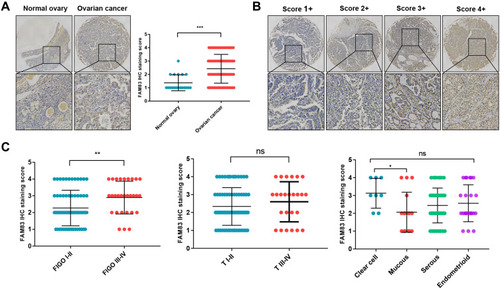
Table 3 Summary of Bioinformation Analysis of FAM83 Genes in Ovarian Cancer