
Figures & data
Table 1 Patients’ Characteristics
Figure 1 CONSORT diagram of this study.
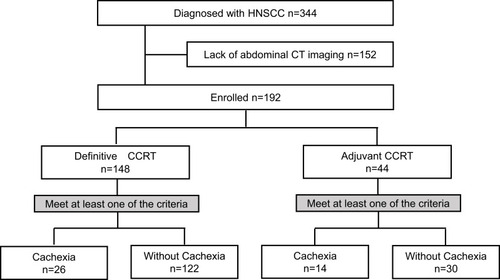
Figure 2 Kaplan–Meier curves for progression-free survival and overall survival according to treatment setting. Definitive CCRT-progression-free survival (PFS) (A), definitive CCRT-overall survival (OS) (B), adjuvant CCRT-progression-PFS (C) and adjuvant CCRT-OS (D) comparing patients with cachexia vs those without cachexia.
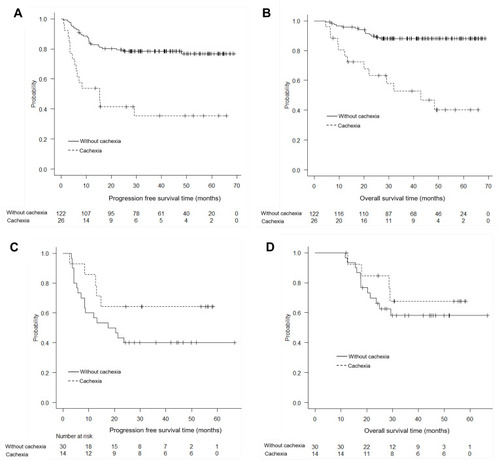
Table 2 Univariate and Multivariate Analysis for PFS
Table 3 Univariate and Multivariate Analyses for OS
Table 4 Frequency of Adverse Events of More Than Grade 3