Figures & data
Figure 1 Effects of melatonin on the growth of human gastric cancer SGC-7901 cells. Cells were exposed to MLT at concentrations of 0.0014, 0.0041, 0.012, 0.037, 0.11, 0.33, 1 and 3 mM, while cells treated with RPMI-1640 medium alone served as the negative control. MTT was employed to determine cell proliferation. The inhibition (%) was calculated as: cell growth upon MLT treatment/cell growth upon negative control treatment. Data are expressed as the mean ± SD from three independent experiments.
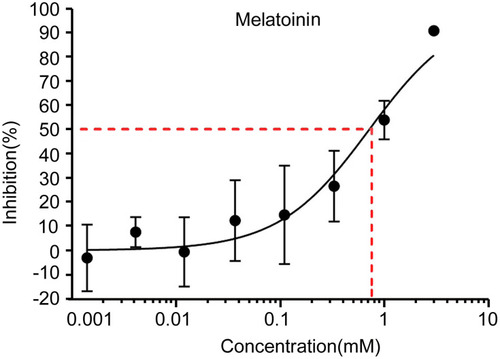
Figure 2 Melatonin inhibits microvessel formation and tumor proliferation of the chick embryo tumor xenograft model. (A) Changes of chick embryo tumor xenografts during administration with melatonin; (B) Comparison of tumor weight; (C) Comparison of tumor volume; (D) Comparison of allantois of chick embryos. Data are presented as the mean ± standard SD. *P < 0.05 vs controls.
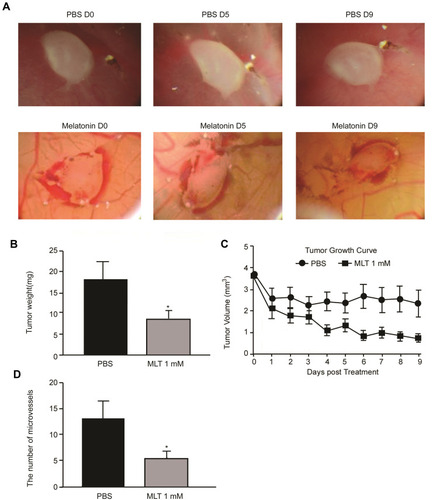
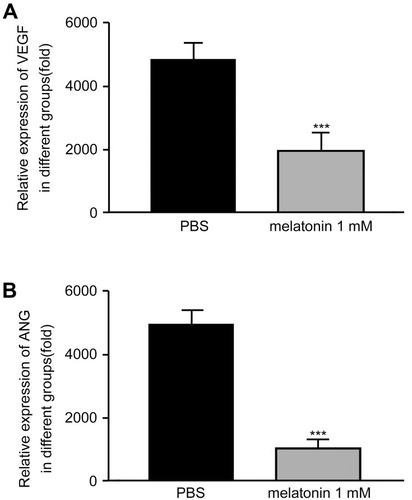
Figure 3 VEGF and angiogenin levels are measured in the supernatant of the chick embryo tumor xenograft model using ELISA. (A) VEGF level; (B) Angiogenin level. Data are expressed as mean ± standard error of the mean of three independent experiments. ***P < 0.05 vs controls.