Figures & data
Table 1 Baseline Characteristics of Patients
Table 2 Associations Between Clinicopathological Features and Leading STM, NLR, and Combination Score
Figure 1 ORR and DCB from the decreased leading STM versus the increased leading STM, and from the decreased NLR versus the increased NLR. ORR and DCB for patients in the overall cohort with different combination scores, and for patients in the cohort of the Third Affiliated Hospital of Shandong First Medical University with different combination scores.
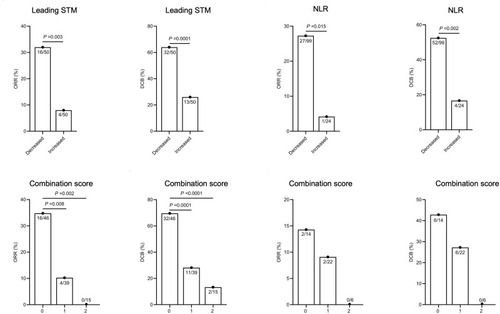
Figure 2 Kaplan–Meier survival curves for progression-free and overall survival according to the leading STM and the NLR. Kaplan–Meier survival curves for progression-free and overall survival according to the combination scores in the overall cohort and in the cohort of the Third Affiliated Hospital of Shandong First Medical University.
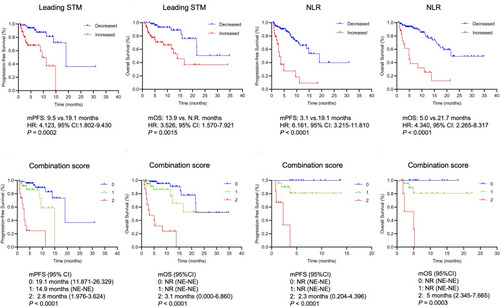
Figure 3 DCB for stable or progressive patients with different combination scores (A). Kaplan–Meier survival curves for progression-free (B) and overall survival (C) according to the combination scores of stable or progressive patients.
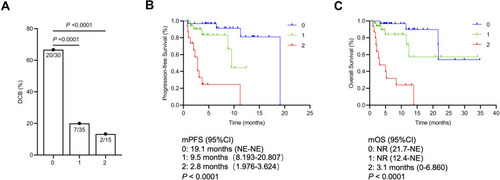
Figure 4 Computed tomography (CT) scans at baseline and at the first and subsequent radiological assessments for 3 representative NSCLC patients treated with PD-1/PD-L1 inhibitors. The first patient (Case 1) with a combination score of 0 (low combination score) had achieved a partial response at the first radiological evaluation and subsequently achieved a complete response (at 14 weeks) with long-term survival (alive; progression-free survival: 30.9 months; overall survival: 30.9 months). The second patient (Case 2) with a combination score of 0 (low combination score) had stable disease at the first radiological evaluation and subsequently exhibited a partial response (at 13 weeks) with long-term survival (alive; progression-free survival: 19.1 months; overall survival: 21.7 months). The third patient (Case 3) with a combination score of 2 (high combination score) had progressive disease at the first radiological evaluation and subsequently exhibited continuous progression (at 12 weeks) with short-term survival (death; progression-free survival: 2.3 months; overall survival: 5.0 months). The arrows indicate lesions in the lungs.
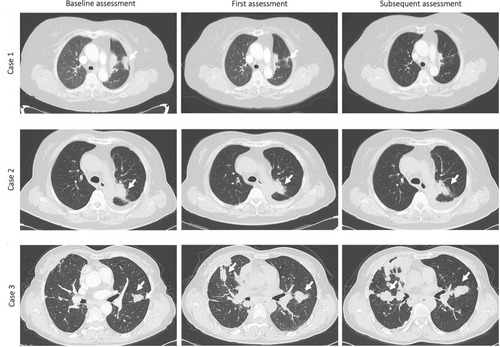
Table 3 Univariate Cox Analyses of PFS and OS
Table 4 Multivariate Cox Analyses of PFS and OS
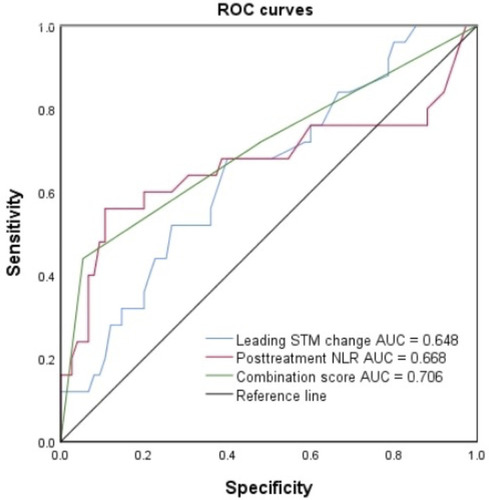
Figure 5 ROC curves for sensitivity and specificity according to leading STM change, posttreatment NLR and the combination score.