
Figures & data
Table 1 Summary of Clinical Characteristics of 110 Lung Cancer Patients
Table 2 Comparison of Protein Expressions of GSDME, HMGB1 and Caspase3 and CD8+T Lymphocyte Abundance in Lung Cancer and Paracancerous Tissues
Table 3 The Relationship Between the Protein Expression of GSDME, HMGB1 and Caspase3 and the Abundance of CD8+ T Lymphocytes and the Clinical Parameters of 110 Lung Cancer Patients
Figure 1 (A–C) represent the high expression of GSDME, caspase3 and HMGB1 proteins in lung cancer tissues, respectively. (D) The expression of high abundance of CD8+T lymphocytes in lung cancer tissues. (E–G) are GSDME, caspase3, HMGB1 protein in lung cancer tissue low expression. (H) Low abundance of CD8+T lymphocytes in lung cancer tissues. (I–L) is the distribution of GSDME, caspase3, HMGB1, and CD8+T lymphocytes in paracancerous tissues. In the figure, the black arrows is a high expression image and the red arrows is a low expression image. (Images were acquired at 200 × magnification.).
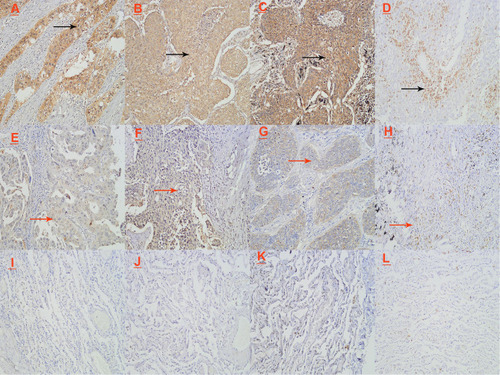
Table 4 Univariate and Multivariate Analysis of Overall Survival
Figure 2 Kaplan-Meier survival curve. In Kaplan-Meier survival analysis, the expression level of GSDME (A), TNM stage (B), lymph node invasion (C) and tumor size (D) were the factors affecting the prognosis of patients (P=0.003, P=0.000, P=0.016, P=0.038, respectively). The expression levels of HMGB1 (E), caspase3 (G) and the abundance of CD8+T lymphocytes (F) were not used as prognostic indicators for the survival of lung cancer patients (P=0.082, P=0.252, P=0.342, respectively). Multivariate analysis of survival curve showed P =0.001 (H). In the TNM staging image, lines of different colors represent different TNM staging, as shown in the notes next to the image. Kaplan-Meier survival curve of other variables, red curve represents high expression and blue curve represents low expression.
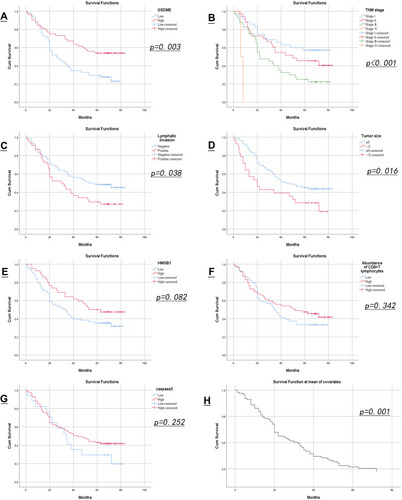
Table 5 Correlation Between GSDME, Caspase3, HMGB1 and CD8+ T Lymphocytes and Other Clinicopathological Parameters of Lung Cancer Patients