Figures & data
Table 1 Primer Sequences Used in the qRT-PCR Assay
Figure 1 Identification of differentially expressed RNA-binding proteins (DE RBPs) in The Cancer Genome Atlas (TCGA) dataset. (A) Heat map of the DE RBPs based on their log2-transformed fragments per kilobase of transcript per million mapped reads (FPKM) expression values. Red represents high expression, and green represents low expression. (B) Volcano plot of DE RBPs between colon adenocarcinoma (COAD) and normal colon tissue; 208 were upregulated, and 122 were downregulated. Red: upregulated RBPs; black: unchanged RBPs; green: downregulated RBPs.
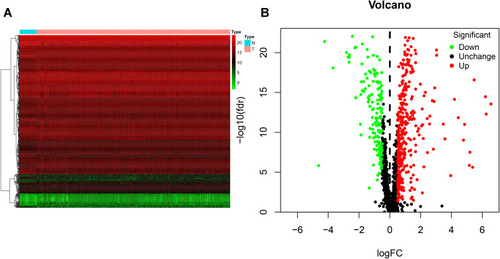
Figure 2 Gene ontology (GO) and Kyoto Encyclopedia of Genes and Genomes (KEGG) analysis of differentially expressed RBPs (DE RBPs). (A) Bubble plot of enriched GO terms. (B) Bubble plot of enriched KEGG pathways.
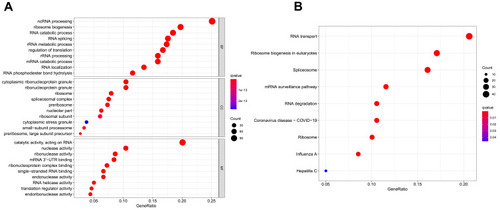
Figure 3 Protein-protein interaction (PPI) network and modules analysis. (A) PPI network for differentially expressed RBPs (DE RBPs). (B) Key module 1 in the PPI network.
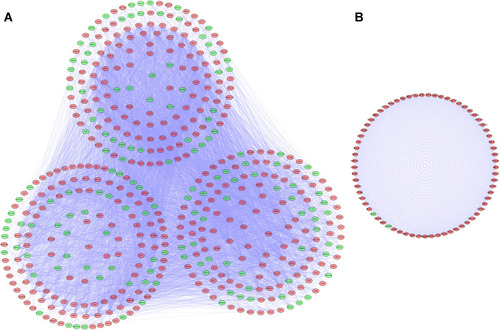
Figure 4 Selection of prognosis-related RBPs in the training cohort. (A) Univariate Cox regression analysis. (B and C) Least absolute shrinkage and selection operator (LASSO) regression analysis. (D) Multivariate Cox regression analysis to screen out the key RNA-binding proteins (RBPs) most relevant to prognosis.
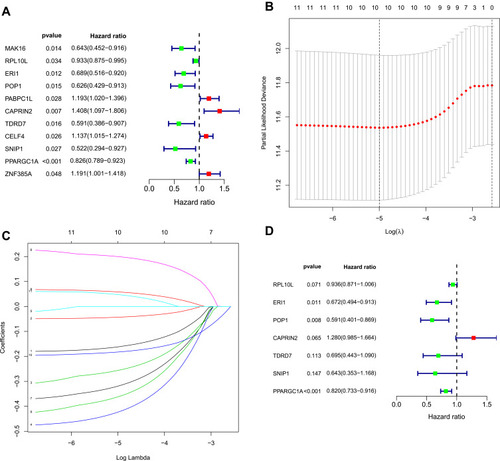
Table 2 Seven Prognosis-Associated Hub RNA-Binding Proteins (RBPs) Identified by Multivariate Cox Regression Analysis
Table 3 The Prognostic Value of Different Clinical Parameters in the Cancer Genome Atlas (TCGA) Cohort
Figure 5 Risk score analysis of the seven-gene prognostic model in The Cancer Genome Atlas (TCGA) cohort. (A) Survival curve for low-risk and high-risk groups. (B) Receiver operating characteristic (ROC) curves for predicting overall survival (OS) based on the risk score. (C) Expression heat map, risk score distribution, and survival status.
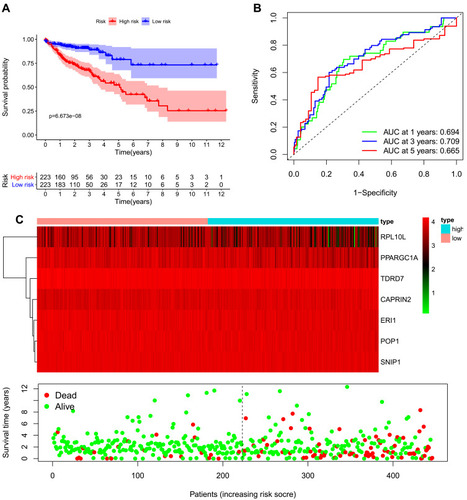
Figure 6 Risk score analysis of the eight-gene prognostic model in the GEO database combined cohort. (A) Survival curve for low-risk and high-risk groups. (B) Receiver operating characteristic (ROC) curves for predicting overall survival (OS) based on the risk score. (C) Expression heat map, risk score distribution, and survival status.
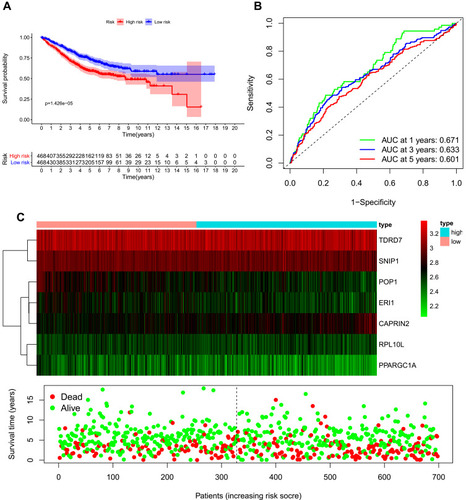
Table 4 The Prognostic Value of Different Clinical Parameters in the GEO Database Combined Cohort
Figure 7 Nomogram (A) for predicting the 1-, 3-, and 5-year overall survival (OS) of colon adenocarcinoma (COAD) patients in The Cancer Genome Atlas (TCGA) cohort. (B) Calibration curves for Nomogram.
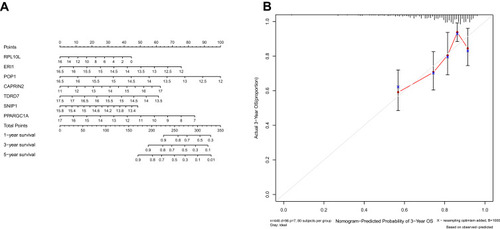
Figure 8 Verification of hub RNA-binding protein (RBP) expression in colon adenocarcinoma (COAD) tissues and normal colon tissues using the Human Protein Atlas (HPA) database. (A) CAPRIN2, (B) ERI1, (C) RPL10L, (D) SNIP1 and (E) TDRD7.
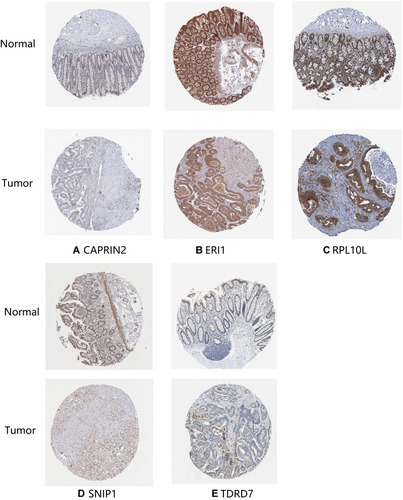
Figure 9 Kaplan-Meier curve analysis of the three prognostic RNA-binding proteins (RBPs), including CAPRIN2, POP1 and PPARGC1A, in The Cancer Genome Atlas (TCGA) cohort.
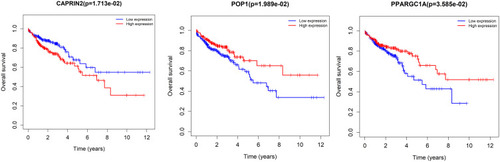
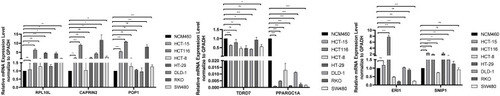
Figure 10 qRT-PCR validation of seven prognosis-related RBP-encoding genes in colon adenocarcinoma (COAD) cell models compared to control cells. *p < 0.05. **p < 0.01. ***p < 0.001.