Figures & data
Table 1 Summary of partial and focal therapy modalities reported
Table 2 Multidisciplinary international consensus group proposal selection
Table 3 Phase II hemigland protocol inclusion criteria
Table 4 Phase II hemigland protocol exclusion criteria
Figure 1 Hemigland brachytherapy implant.
Note: Computed tomography (contours of the prostate in red, target in yellow, rectum in blue. 100%, 150%, and 200% isodose lines in green, yellow, and red). The green triangles and circles indicate seed positions.
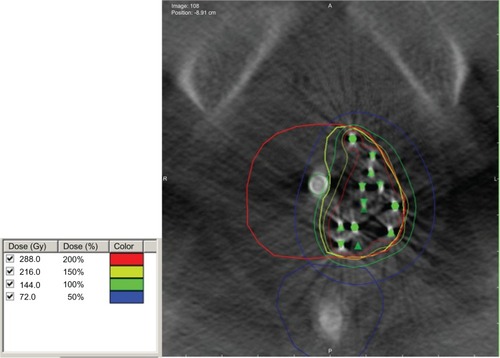
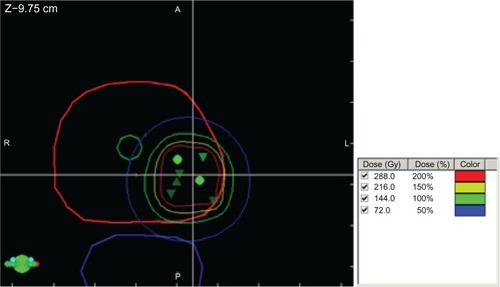
Figure 2 Representative image of a focal brachytherapy implant.
Notes: Contours of the prostate in red, urethra in green, and rectum in blue. The 100%, 150%, and 200% isodose lines are in green, yellow, and red. The green triangles and circles indicate seed positions.