Figures & data
Figure 1 Generation and characterization of anti-CLDN18.2-anti-CD28 bispecific antibody. (A) Schematic diagrams of bispecific antibody, anti-CLDN18.2-anti-CD28 (top), and isotype control protein, anti-CLDN18.2 (bottom). (B) SDS-PAGE of purified anti-CLDN18.2-anti-CD28 (58 kDa) and anti-CLDN18.2 (30 kDa) proteins. (C and D) Dose-dependent binding affinity of anti-CLDN18.2 arm of the bispecific protein to Lenti-X 293-CLDN18.2 (C) or B16-OVA-CLDN18.2 cells (D) expressing CLDN18.2. (E and F) Dose-dependent binding affinity of anti-CD28 arm of the bispecific protein to Lenti-X 293-CD28 cells (E) or splenocytes from C57BL/6 mice (F).
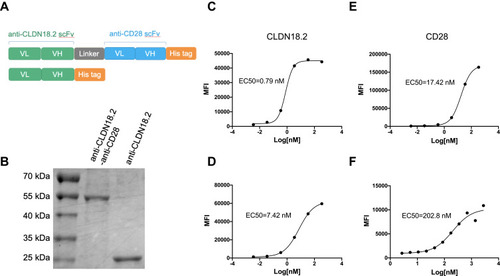
Figure 2 Co-stimulatory activation of anti-CLDN18.2-anti-CD28 is dependent on the recognition of CLDN18.2. 2×10⁵ OT-I CD8+ T cells were incubated with 1×10⁴ B16-OVA or B16-OVA-CLDN18.2 cells in the absence or presence of different concentrations of anti-CLDN18.2-anti-CD28 in vitro. (A–C) Percentage of CD69+CD8+ T cells after 72 h of incubation (A) and release of IFN-γ (B) and TNF-α (C) in the supernatant, measured after 24 h of incubation; n = 3, data are shown as means ± SEM; **P < 0.01, ***P < 0.001.
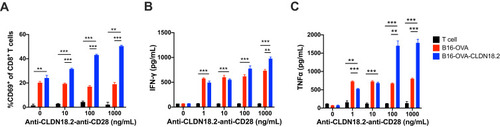
Figure 3 Safety profile of anti-CLDN18.2-anti-CD28 in naïve C57BL/6 mice. Mice were injected i.p. with vehicle buffer (PBS) or 100 μg anti-CLDN18.2-anti-CD28 on day 0. (A–C) Platelet (A), WBC (B), and RBC (C) counts in the blood were measured on day 7. (D) The weights of the mice were measured every day after treatment with vehicle buffer (PBS) or anti-CLDN18.2-anti-CD28. Data are shown as means ± SEM; n = 5, n.s., P > 0.05. (E) H&E staining of major organs (heart, liver, spleen, lung, kidney, and stomach) from treated mice on day 7.
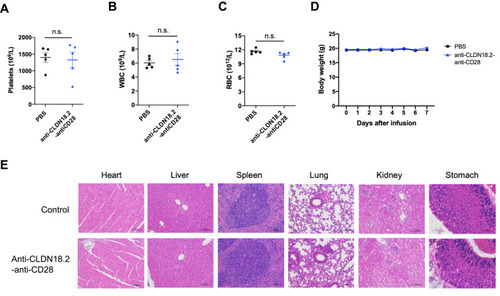
Figure 4 Anti-CLDN18.2-anti-CD28 mainly reduced the tumor burden by activating long-term tumor-specific T cells in TME. (A–D) C57BL/6 mice were inoculated subcutaneously with 2.5×10⁵ B16-OVA-CLDN18.2 cells on day 0. Vehicle buffer (PBS), anti-CLDN18.2, and bispecific antibody (anti-CLDN18.2-anti-CD28) were peri-tumor-injected on days 8 and 11. Mice were euthanized on day 13. Percentage of CD8+ or CD4+ T cells (A) in tumor-infiltrating myeloid populations and expression of CD69 on CD8+ or CD4+ T cells (B) in tumor-infiltrating lymphocytes were analyzed on day 13. (C and D) Splenic and lymph node cells from mice were separated and incubated in the absence or presence of OT-I or OT-II peptide. IFN-γ and TNF-α in the supernatants of splenocyte (C) and lymph node cell (D) cultures were measured after 48 h; n = 5. (E and F) C57BL/6 mice were inoculated subcutaneously with 2.5×10⁵ B16-OVA-CLDN18.2 tumor cells. Tumor size (E) and weight (F) of mice. Black arrows indicate the time points of antibody injection; n = 5–6. (G and H) Mice inoculated subcutaneously with B16-OVA-CLDN18.2 were treated with vehicle buffer and anti-CLDN18.2-anti-CD28 with or without deletion antibody (anti-CD8) on days 8 and 11. The tumor size (G) and survival curves (H) were measured and recorded, respectively. Black arrows indicate the time points of antibody injection; n = 6. Statistical significance of survival experiments was determined using the Mantel-Cox test. All the data are shown as means ± SEM; *P < 0.05, **P < 0.01, ***P < 0.001.
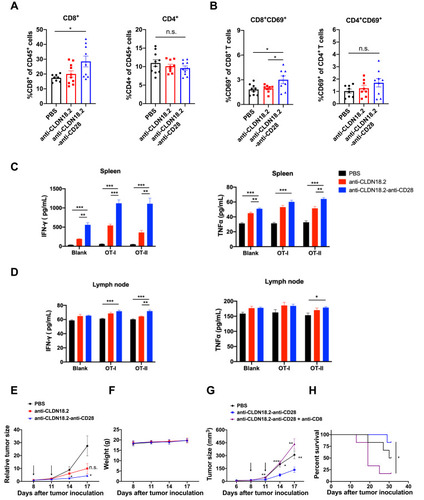
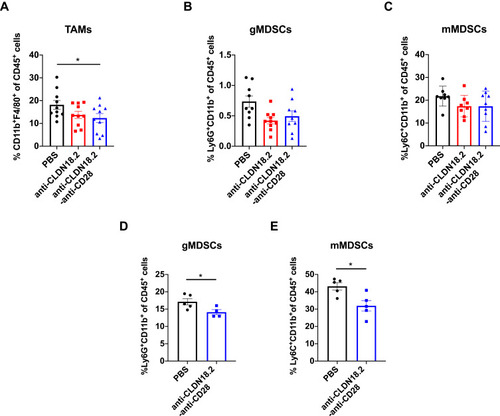
Figure 5 Anti-CLDN18.2-anti-CD28 reduced the immunosuppressive components in tumor microenvironment. Tumor-infiltrating immune cells were acquired from B16-OVA-CLDN18.2 mouse models. (A) Proportion of intra-tumoral macrophage subpopulation from C57BL/6 mice. (B and C) Proportion of intra-tumoral CD11b+Ly6G+ MDSCs (B) and CD11b+Ly6C+ MDSCs (C) from C57BL/6 mice. In (A–C), tumors were resected and analyzed on day 12 after B16-OVA-CLDN18.2 inoculation; n = 8–10, data were shown as the mean ± SEM; *P < 0.05. (D and E) Proportion of intra-tumoral CD11b+Ly6G+ MDSCs (D) and CD11b+Ly6C+ MDSCs (E) from C57BL/6 mice. Tumors were resected and analyzed on day 18 after B16-OVA-CLDN18.2 tumor cells inoculation; n = 5, data were shown as means ± SEM; *P < 0.05.