Figures & data
Figure 1 The expression of HNRNPC mRNA in various types of cancers. (A) TCGA database (paired samples), Wilcoxon signed-rank test. (B) ONCOMINE database, the threshold values were set as following: p-value: 0.05, fold change: 1.5, gene rank: top 10%, data type: mRNA. The graphic represents the numbers of datasets in which HNRNPC mRNA expressions were up-regulated (red) or down-regulated (blue). *p<0.05, **p<0.01, ***p<0.001.
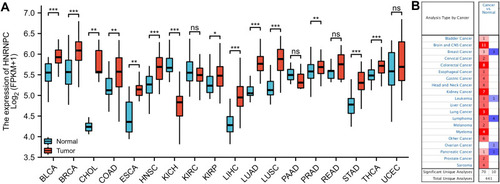
Table 1 Details of GEO Series Included in This Analysis
Figure 2 The expression of HNRNPC mRNA in PCa tissues and normal prostate tissues (GEO and TCGA database). (A) GSE46602, Welch's t-test. (B) GSE60239, students’ t-test. (C) GSE104749, students’ t-test. (D) GSE140927, students’ t-test (paired). (E) GSE8511, One-way ANOVA, and Bonferroni’s multiple comparisons test. (F) GSE70770, One-way ANOVA, and Bonferroni’s multiple comparisons test. (G) TCGA PRAD, unpaired samples, Wilcoxon rank-sum test. (H) TCGA PRAD, paired samples, Wilcoxon signed-rank test. (I) qPCR verification of PCa samples collected by ourselves, paired samples, Wilcoxon signed-rank test. *p<0.05, **p<0.01, ***p<0.001.
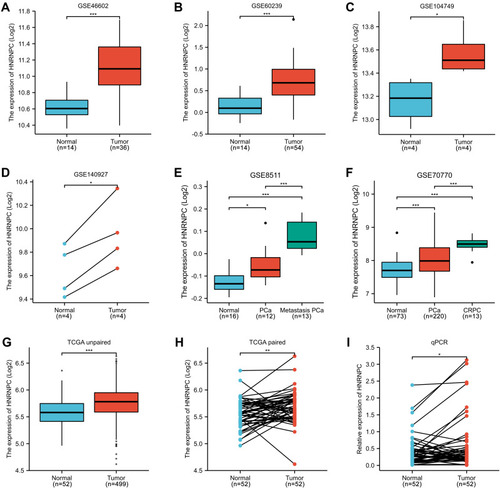
Table 2 Correlation Between HNRNPC Expression and Clinicopathological Characteristics in PCa
Figure 3 Relationship between HNRNPC mRNA expression and clinicopathologic characteristics in PCa (TCGA database). (A) The relationship between HNRNPC mRNA expression and T stage, Wilcoxon rank-sum test. (B) The relationship between HNRNPC mRNA expression and N stage, Wilcoxon rank-sum test. (C) The relationship between HNRNPC mRNA expression and Gleason score, Wilcoxon rank-sum test. (D) The relationship between HNRNPC mRNA expression and PSA level, Wilcoxon rank-sum test. (E) The relationship between HNRNPC mRNA expression and Residual tumor, Wilcoxon rank-sum test. (F) ROC curve showed the efficiency of HNRNPC mRNA expression to distinguishing PCa tissue from non-tumor tissue. (G-I) Kaplan–Meier curve showed the prognostic value of HNRNPC in OS, DSS, and PFI of PCa patients. *p<0.05, **p<0.01, ***p<0.001.
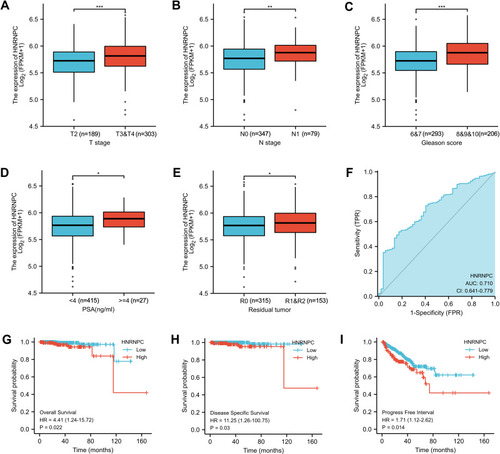
Figure 4 Knocking-down HNRNPC inhabits PCa cell proliferation, migration, and invasion in vitro. (A and B) qRT-PCR of the relative expression of HNRNPC mRNA in PC-3 and DU145 cells transfected with HNRNPC specific shRNA plasmids or negative control shRNA plasmid. The data are presented as the mean ± SD. One-way ANOVA and Dunnett’s multiple comparisons test, n=3. (C) Western blot of the relative expression of HNRNPC protein in PC-3 and DU145 cells transfected with HNRNPC specific shRNA plasmids or negative control shRNA plasmid. (D) Colony formation assays of the above-mentioned different transfected PCa cells. (E–H) EdU assays and their corresponding column charts of different transfected PCa cells. Scale bar, 100um. The data are presented as the mean ± SD. One-way ANOVA and Dunnett’s multiple comparisons test, n=3. (I and J) Transwell assay of different transfected PCa cells. (K and L) Wound-healing assay of different transfected PCa cells. **p<0.01, ***p<0.001, ****p<0.0001.
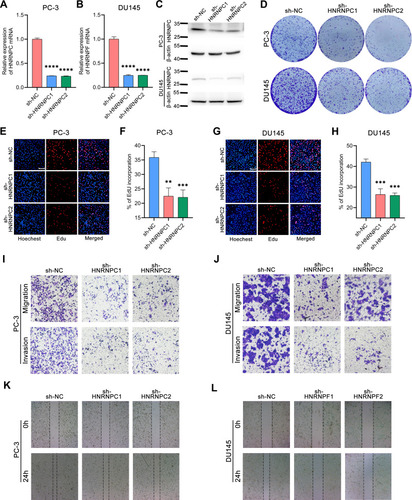
Figure 5 Relationship between HNRNPC mRNA expression and immune infiltration in the tumor microenvironment. (A) The forest plot of the correlation between HNRNPC mRNA expression and various immune cells. (B–E) The infiltration level of NK cells, Tem, pDC, and Th2 cells in HNRNPC high and low expression groups. Wilcoxon rank-sum test, n=133. (F–I) The correlation between HNRNPC mRNA expression and the infiltration level of NK cells, Tem, pDC, and Th2 cells. *p<0.05, **p<0.01, ***p<0.001, ****p<0.0001.
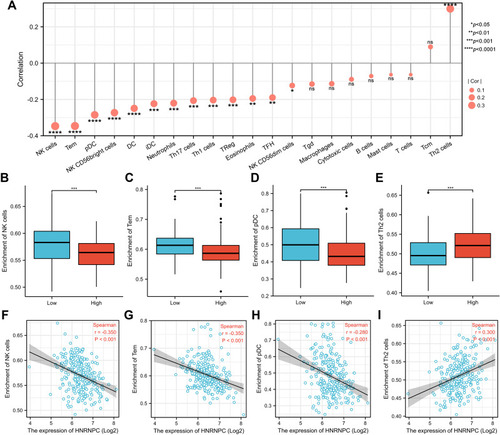
Figure 6 Heat map of top 50 co-expressed genes with HNRNPC (TCGA database).
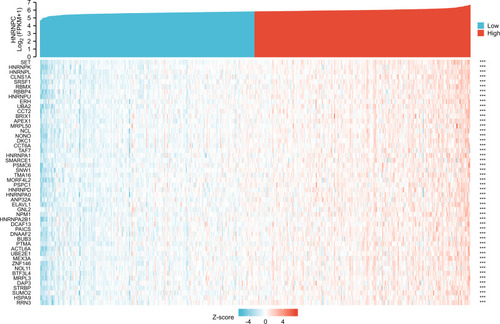
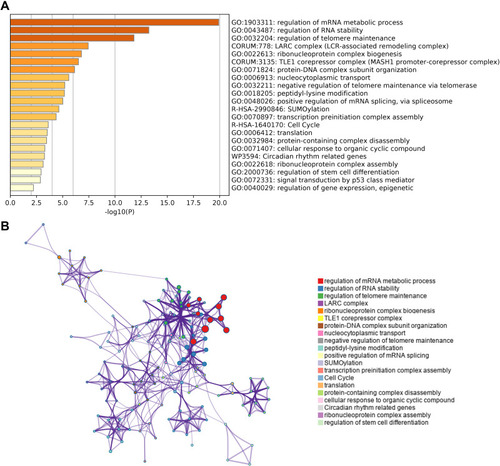
Figure 7 Predicted pathways of HNRNPC and its top 50 co-expression genes (Metascape). (A) Top 22 enriched pathways. (B) Interaction network of enriched pathways.