Figures & data
Table 1 Characteristics of the Participants
Figure 1 Levels of plasma PKM2 in healthy individuals, AML patients and ALL patients. Plasma samples from AML patients (n= 56), ALL patients (n= 40), AML healthy individuals (n = 29) and ALL healthy individuals (n = 37) were quantified by ELISA. (A) AML patients displayed significantly higher levels of PKM2 (593.11±495.30 pg/mL) compared with healthy individuals (268.12±131.67 pg/mL) (p<0.01). (B) The levels of PKM2 in the plasma in the ALL patients (495.05±327.27 pg/mL) had a significant increase compared with healthy individuals (230.13±147.63 pg/mL) (p<0.05). *p < 0.05; **p < 0.01.
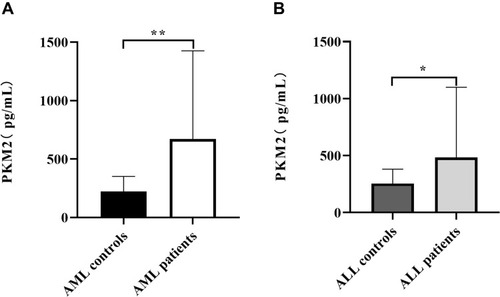
Figure 2 Receiver operating characteristic curve for evaluating AML and ALL by PKM2. PKM2 could distinguish the AML patients from healthy individuals with an AUC of 0.827. Moreover, the sensitivity was 91.2%, and the specificity was 66.7%. PKM2 could distinguish the ALL patients from healthy individuals with an AUC of 0.837. Moreover, the sensitivity was 88.2%, and the specificity was 66.7%.
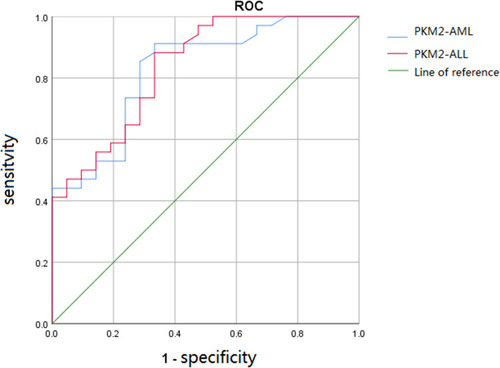
Figure 3 Comparison of PKM2 levels in leukemia patients harboring fusion genes. The presence of the PML/RARA fusion gene in AML patients was 23.33%, while the BCR/ABL and TEL/AML1 fusion genes in ALL patients were present in 19.56% and 15.22% of patients, respectively. (A) The level of PKM2 in AML patients with the PML/RARAL fusion gene (365.70±92.12 pg/mL) was lower than that in other patients without this gene fusion (583.15±465.35 pg/mL) (p>0.05). (B) PKM2 levels in ALL patients with the BCR/ABL gene fusion (909.05±806.07 pg/mL) were higher than those in other patients without this gene fusion (393.16±153.71 pg/mL) (p<0.05). (C) PKM2 levels in AML patients with TEL/AML1 gene fusion (179.75±64.59 pg/mL) were lower than those in other patients without this gene fusion (393.16±153.71 pg/mL) (p>0.05). *p < 0.05; ns, not significant.
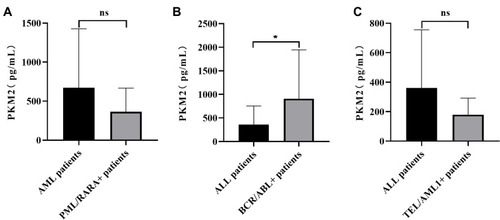
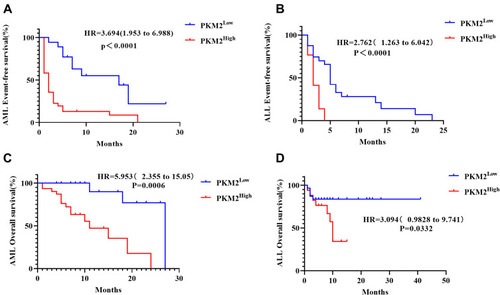
Figure 4 Survival curves of AML and ALL patients. According to survival analysis, the EFS and OS of acute leukemia patients with high PKM2 expression were significantly lower than those with low PKM2 expression. (A) The EFS of AML patients with high PKM2 expression were significantly lower than those with low PKM2 expression (p<0.0001). (B) The EFS of ALL patients with high PKM2 expression were significantly lower than those with low PKM2 expression (p<0.0001). (C) The OS of AML patients with high PKM2 expression were significantly lower than those with low PKM2 expression (p=0.006). (D) The OS of ALL patients with high PKM2 expression were lower than those with low PKM2 expression (p=0.0332).