Figures & data
Figure 1 Gene expression level of PGDH was lower in Lung adenocarcinoma (LUAD) tissues compared with normal tissues. (A) PGDH gene expression level analysis between TCGA tumor samples and TCGA normal samples. (B) PGDH gene expression level analysis between TCGA tumor samples and TCGA normal + GTEx normal samples. TPM, Transcripts Per Million. The expression data were log2(TPM+1) transformed for differential analysis. *p<0.05.
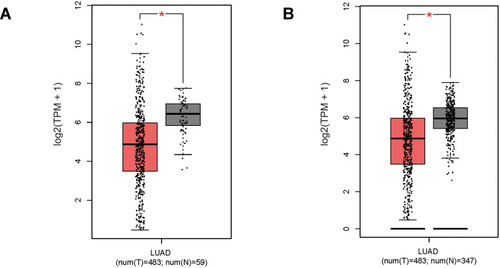
Figure 2 15-PGDH overexpression in A549 cells suppressed cell proliferation. (A) PLVX-PGDH-IRES-ZsGreen1 plasmid map visualization was performed with SnapGene software. (B) A 15-PGDH overexpression single clone cell line with intense and uniform GFP expression (400×). (C) Western blotting analysis confirmed that 15-PGDH is overexpressed successfully in A549 cells. (D) qPCR analysis confirmed overexpressed PGDH mRNA levels in A549 cells. (E) Growth curves of EV and PGDH(+) A549 cells determined by CCK-8 assay. Cell proliferation rates were represented as the ratio between OD450 at a particular time point and 0 hour. All values represent mean from three biological replicates ± SEM. Data were analyzed using Student’s t-test. ***p< 0.001.
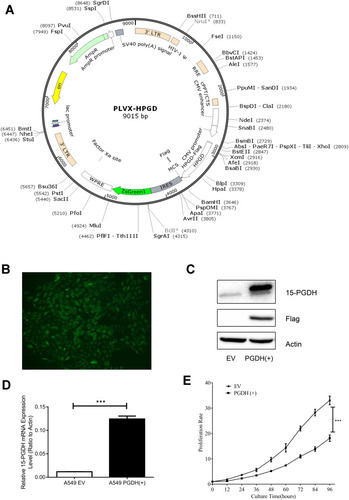
Figure 3 Quantitative proteomic study of EV and PGDH(+) A549 cells. (A) The schematic diagram of TMT-based quantitative proteomic analysis of EV and PGDH(+) A549 cells. (B) Functional classification of down-regulated proteins between EV and PGDH(+) A549 cells by PANTHER bioinformatics platform (http://www.pantherdb.org).
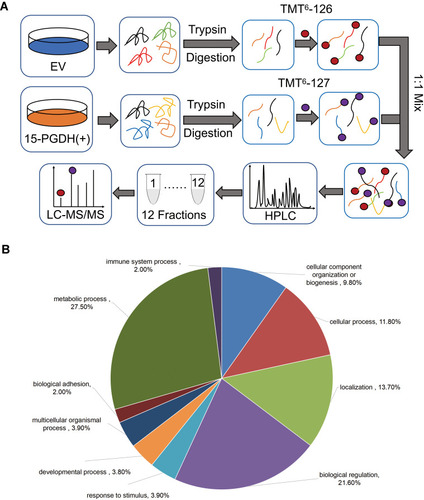
Figure 4 Proteomic analysis of EV and PGDH(+) A549 cells using IPA software and String database. (A) TMT ratios of down-regulated proteins related to cell growth and proliferation. (B) TMT ratios of down-regulated proteins related to cell cycle and DNA repair. (C) The enriched canonical pathways of differentially expressed proteins by IPA analysis. (D) Interaction network of down-regulated proteins between PGDH(+) and EV cells was analyzed by String software.
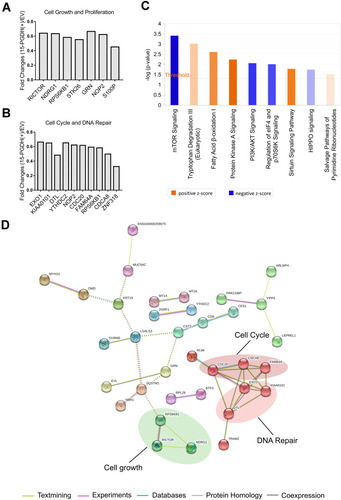
Figure 5 Identification of 15-PGDH-interacting proteins. Analysis of 15-PGDH-interacting proteins using String database.
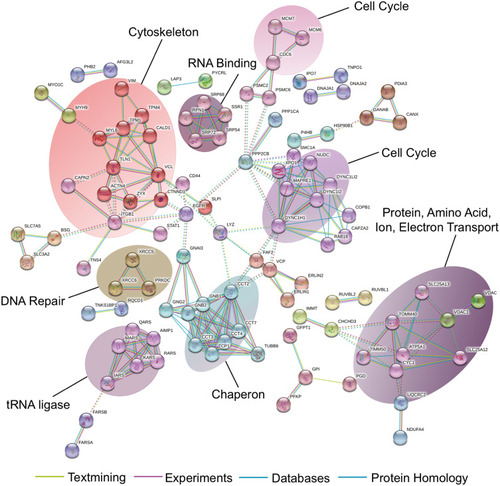
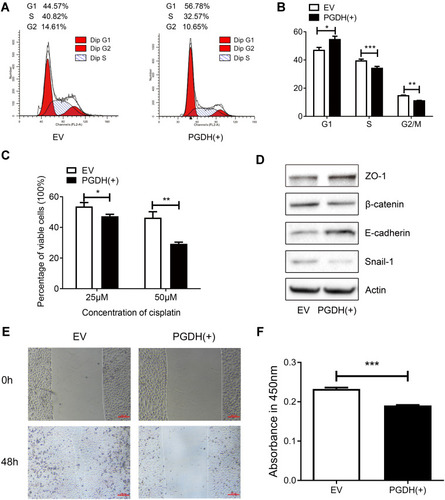
Figure 6 15-PGDH overexpression leads to G1/S arrest, increases cell susceptibility to cisplatin, and inhibits EMT process. (A) A representative cell cycle analysis determined by flow cytometry of EV and PGDH(+) cells. (B) Cell cycle analysis of EV and PGDH(+) cells. (C) Percentage of viable cells between EV and PGDH(+) cells treated with different concentrations of cisplatin for 30 h. (D) Western blotting of expression levels of ZO-1, β-catenin, E-cadherin, Snail1, and β-actin in EV and PGDH(+) cells. (E) Cell migration capacity of EV and PGDH(+) cells were determined by wound healing assay. Scale bar, 200 μm. (F) Cell invasion capacity of EV and PGDH(+) cells were determined using transwell assay. All values represent mean from three biological replicates ± SEM. Data were analyzed using Student’s t-test. *p < 0.05, **p < 0.01, ***p < 0.001.