Figures & data
Table 1 Accuracy, Sensitivity, Specificity, Accuracy, PPV, and NPV of Different Assessment Methods for the Prediction of Neoadjuvant Chemotherapy Response in Breast Cancer
Figure 1 ① Representative ultrasound B-mode images and elastography images for a nonresponder and a responder acquired before and after treatment. (A) Nonresponders typically exhibited no change in tumor elasticity during treatment for several weeks (average strain ratios ranged from 1.29±0.04 before treatment to 1.23±0.11 at week 8). (B) Responders exhibited visibly detectable changes in tumor stiffness (average strain ratios ranged from 1.26±0.11 before treatment to 1.04±0.05 at week 8). Reprinted from Translational Oncology, Vol 6/edition number 1, Falou O, Sadeghi-Naini A, Prematilake S, et al, Evaluation of neoadjuvant chemotherapy response in women with locally advanced breast cancer using ultrasound elastography, Pages No.17–24, Copyright (2013), with permission from Elsevier. Citation57 ② SWE and corresponding pathologic images from a complete response patient after NAC. (A) The mean tumor stiffness value as determined at baseline was 223.1 kPa. (B) After the second cycle of chemotherapy, the mean tumor stiffness value was 44.7 kPa, and Δ-stiffness was 77.9%. (C and D) Pathological results before chemotherapy and after surgery. Reproduced with permission from Jing H, Cheng W, Li ZY, et al, Early evaluation of relative changes in tumor stiffness by shear wave elastography predicts the response to neoadjuvant chemotherapy in patients with breast cancer and John Wiley & Sons, Inc. © 2016 by the American Institute of Ultrasound in Medicine.Citation72 ③ CEUS and TIC images from a complete response patient after NAC. Before NAC, (A) grayscale US showed a hypoechoic lesion with an irregularly shaped and distinct margin. (A) A CEUS image obtained 39 s after contrast agent injection showed an inhomogeneous hyperenhancement lesion with an indistinct margin. (B) The TIC on CEUS shows strong and rapid perfusion. After NAC, (C) US showed a decrease in the tumor size. (C) CEUS showed hypo-enhancement. (D) The TIC at CEUS shows weak and slow enhancement. Reprinted from European Journal of Radiology, Vol 103, Wan CF, Liu XS, Wang L, Zhang J, Lu JS, Li FH, Quantitative contrast-enhanced ultrasound evaluation of pathological complete response in patients with locally advanced breast cancer receiving neoadjuvant chemotherapy, Pages No. 118–123, Copyright (2018), with permission from Elsevier Citation49 ④ Example of the ABVS used for response evaluation. Frontal view (anterior-posterior) of the right breast. The left picture shows the tumor (upper left corner) pre-NAC. The right picture shows the same patients mid-NAC with a smaller tumor (upper left corner). Adapted from European Journal of Radiology, Vol 104, van Egdom LSE, Lagendijk M, Heijkoop EHM, et al, Threedimensional ultrasonography of the breast; An adequate replacement for MRI in neoadjuvant chemotherapy tumour response evaluation? - RESPONDER trial, Pages No. 94–100, Copyright (2018), with permission from Elsevier.Citation74
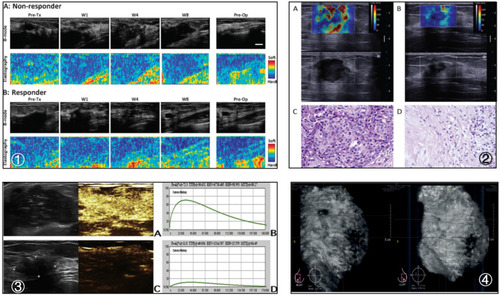
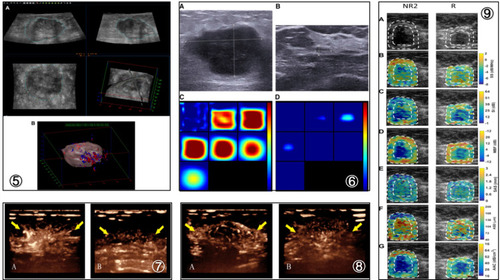
Figure 2 ⑤ Tumor margin obtained on 3D-HDF US images and an established 3D contour. (A) The tumor margin was sketched on a 2D slice B-mode US image, and the 3D contours were then established. The sketched margin is indicated with a blue dotted line. (B) Full image of 3D contours and vascular flow direction of the tumor. Reproduced from Shia WC, Huang YL, Wu HK, Chen DR, Using flow characteristics in three-dimensional power Doppler ultrasound imaging to predict complete responses in patients undergoing neoadjuvant chemotherapy and John Wiley and Sons. © 2017 by the American Institute of Ultrasound in Medicine.Citation80 ⑥ Image of a responder case obtained by using ultrasound-guided diffuse optical tomography. (A and B) US images show US measuring a presize of 3.6 cm and a postsize of 0.7 cm in diameter. (C and D) Pre- and posttreatment reconstructed optical absorption maps show that the lesion was resolved in slices from 1 (top left, left to right) to 7 (bottom left, left to right) and from 2 to 4 (top row, left to right). The pre- and posttreatment THCs were 279.0 μmol/L and 128.0 μmol/L, respectively. The vertical color scale from blue to red is the THC in micromoles per liter from low to high. Reprinted from Translational Oncology, Vol 11/edition number 1, Zhi W, Liu G, Chang C, et al, Predicting treatment response of breast cancer to neoadjuvant chemotherapy using ultrasound-guided diffuse optical tomography, Pages No.56–64, Copyright (2018), with permission from Elsevier.Citation91 ⑦ Changes in peripheral vessels before and after completion of NAC in breast cancer patients displayed by 3D-CEUS. (A) Before NAC, the 3D-CEUS image showed coarse peripheral vessels with radial distribution (arrow) at the strongest stage of perfusion. (B) After completion of NAC, radial peripheral vessels (arrow) disappeared at the strongest stage of perfusion. Reproduced from Jia WR, Tang L,Wang DB, et al. Three-dimensional contrast-enhanced ultrasound in response assessment for breast cancer: a comparison with dynamic contrast-enhanced magnetic resonance imaging and pathology. Sci Rep. 2016;6:33832.Citation81 ⑧ Changes in rim perfusion displayed by 3D-CEUS before and after completion of NAC for another breast cancer patient. (A) Before NAC, 3D-CEUS image showed coarse rim perfusion (arrow) at the strongest stage of perfusion. (B) After completion of NAC, rim perfusion (arrow) disappeared at the strongest stage of perfusion. Reproduced from Jia WR, Tang L,Wang DB, et al. Three-dimensional contrast-enhanced ultrasound in response assessment for breast cancer: a comparison with dynamic contrast-enhanced magnetic resonance imaging and pathology. Sci Rep. 2016;6:33832.Citation81 ⑨ QUS images from a representative non-responder (NR2) patient and a representative responder patient with outlines of core and margin ROIs. (A) B-mode images, (B) SS image, (C) SI images, (D) MBF images, (E) SAS images, (F) ASD, and (G) AAC images obtained prior to chemotherapy treatment initiation. Reproduced from Tadayyon H, Gangeh M, Sannachi L, et al. A priori prediction of breast tumour response to chemotherapy using quantitative ultrasound imaging and artificial neural networks. Oncotarget. 2019;10 (39):3910–3923.Citation88