Figures & data
Figure 1 Schematic diagram of the research process.
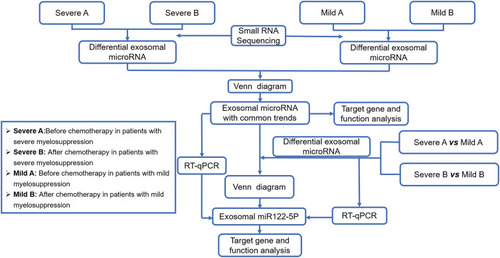
Figure 2 Screening and functional analysis of chemotherapy-related exosomal miRNAs. (A and B) Differential expression of exosomal miRNAs in different groups of patients before and after chemotherapy. (C and D) Venn diagram and heatmap analysis of differentially expressed exosomal miRNAs in different groups of patients with a common expression trend before and after chemotherapy. (E and F) GO and KEGG analyses of the functions of differentially expressed exosomal miRNAs.
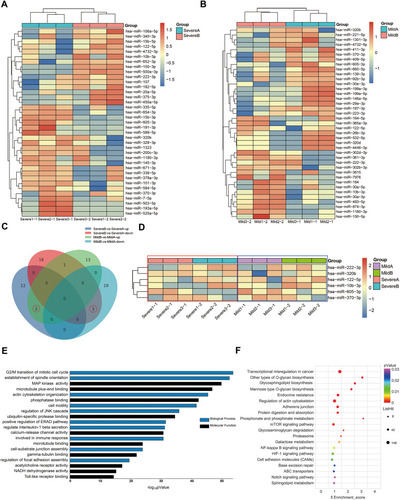
Figure 3 Screening and functional analysis of myelosuppression-related exosomal miR-122-5p. (A) Small RNA sequencing was performed to detect levels of exosomal miRNAs in colorectal cancer patients with mild and severe myelosuppression after chemotherapy. (B) Small RNA sequencing was performed to detect levels of exosomal miRNAs in colorectal cancer patients with mild and severe myelosuppression before chemotherapy. (C) A Venn diagram was built to screen differentially expressed exosomal miRNAs.
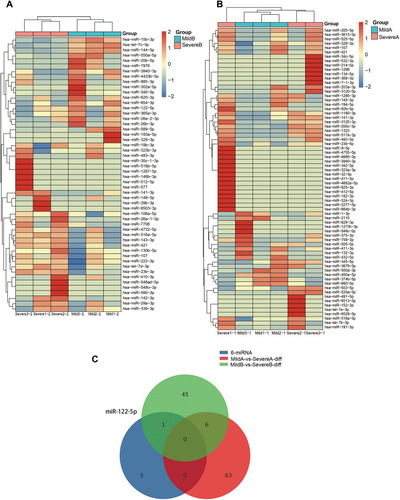
Figure 4 Validation of chemotherapy-related exosomal miRNAs by RT-qPCR. (A and B) Detection of differentially expressed exosomal miRNAs in colorectal cancer patients with mild myelosuppression before and after chemotherapy by RT-qPCR. (C and D) Detection of differentially expressed exosomal miRNAs in colorectal cancer patients with severe myelosuppression before and after chemotherapy by RT-qPCR.
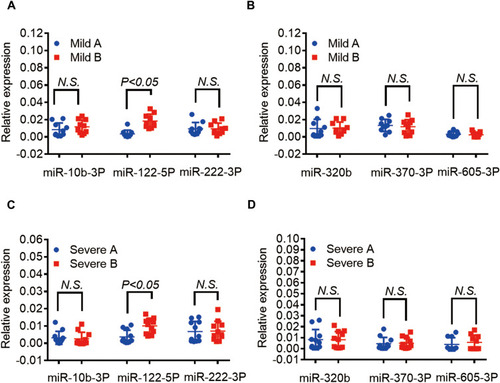
Figure 5 Validation of myelosuppression-related exosomal miR-122-5p by RT-qPCR. (A and B) Comparison of exosomal miRNA expression levels before chemotherapy in colorectal cancer patients with mild and severe myelosuppression by RT-qPCR. (C and D) Comparison of exosomal miRNA expression levels after chemotherapy in colorectal cancer patients with mild and severe myelosuppression by RT-qPCR.
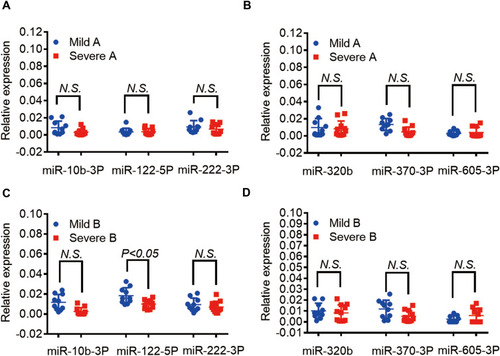
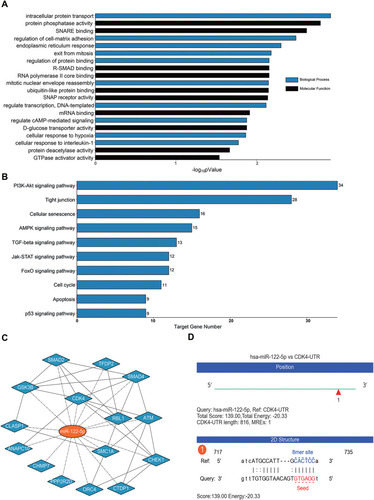
Figure 6 Target gene prediction and functional analysis of exosomal miR-122-5p. (A and B) GO and KEGG analyses of the function of exosomal miR-122-5p. (C) Interaction network diagram of miR-122-5p and its target. (D) miR-122-5p and CDK4 binding sites.