Figures & data
Figure 1 Differential expression profiles. (A) Differential lncRNA between metastatic and non-metastatic OS; (B) Differential mRNA between metastatic and non-metastatic OS.
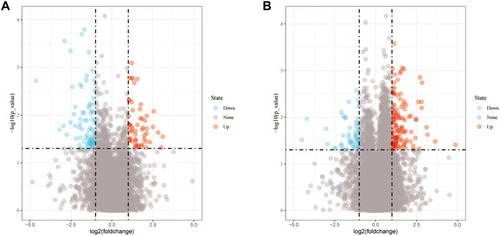
Figure 2 Identification of the prognosis-related lncRNA. (A and B) LASSO coefficient profiles; (C) multivariate cox analysis of seven model lncRNAs; (D) the risk scores, ROC curve, and Kaplan–Meier curve of patients.
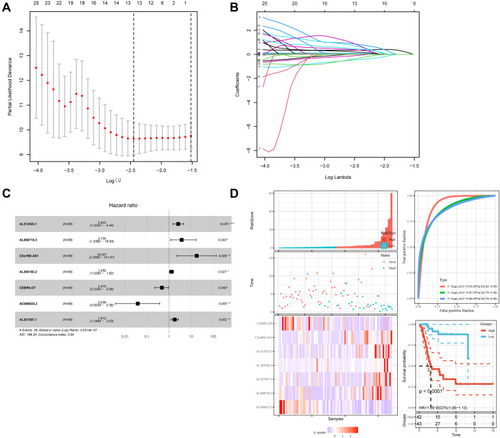
Figure 3 Kaplan–Meier curve of seven prognosis-related lncRNAs. (A) AL512422.1. (B) AL008718.3. (C) AC006033.2. (D) AL357507.1. (E) AL360182.2. (F) C5orf66-AS1. (G) CEBPA-DT.
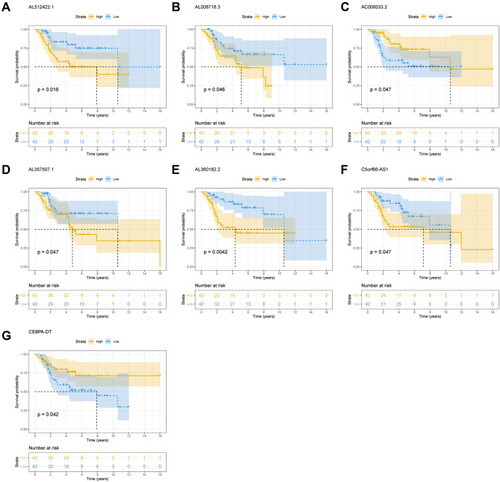
Table 1 Transcription Factors Associated with 24 Intersecting mRNAs
Figure 4 Co-expression network and enrichment analysis. (A) Co-expression network of lncRNA and mRNA; (B) Co-expression network of mRNA and TF; (C) GO analysis of the genes in co-expression network.
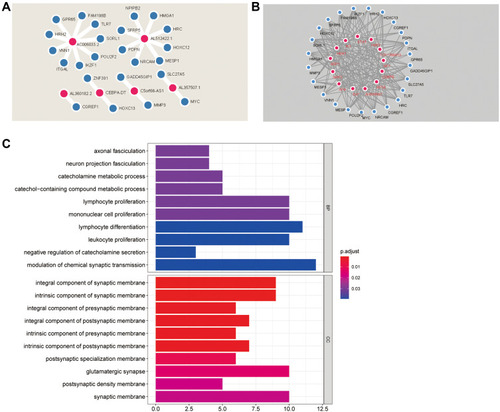
Figure 5 GSVA enrichment analysis of seven prognosis-related lncRNAs. (A) AL512422.1. (B) AL008718.3. (C) AC006033.2. (D) AL357507.1. (E) AL360182.2. (F) C5orf66-AS1. (G) CEBPA-DT.
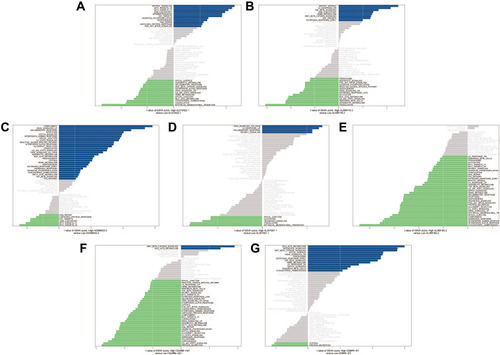
Figure 6 LncRNA and immune analysis. (A) Relationship between high/low group and immune cells; (B) Relationship between seven prognosis-related lncRNAs and immune cells. *<0.05, **<0.01.
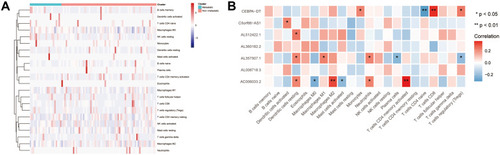
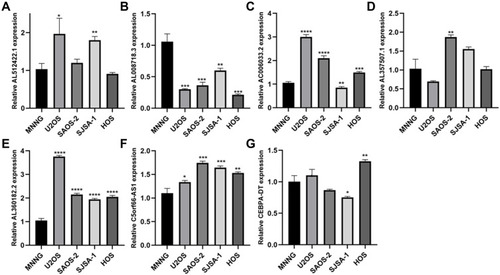
Figure 7 The qPCR result of seven lncRNAs in five OS highly metastasis and weakly metastasis cell lines. (A) AL512422.1. (B) AL008718.3. (C) AC006033.2. (D) AL357507.1. (E) AL360182.2. (F) C5orf66-AS1. (G) CEBPA-DT. *<0.05, **<0.01, ***<0.001, ****<0.0001.