Figures & data
Table 1 Primers of RT-qPCR
Figure 1 MiRNA screening and validation from DDP-resistant and DDP-sensitive gastric cancer cell lines. (A) Venn diagram on total number (in parenthesis) and overlapping number of differentially expressed miRNAs calculated in cell line pairs consisting of the cisplatin-resistant (/DDP added to the paternal cell line’s name) relative to the cisplatin-sensitive paternal cell lines. (B) Relative expression level of miR-181a-2-3p in DDP-resistant and DDP-sensitive cells detected by RT-qPCR.
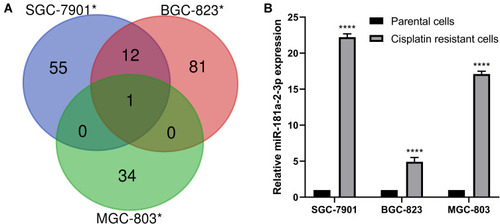
Table 2 The Correlation Between miR-181a-2-3p Expression and Clinical Parameters in GC Patients (n=91)
Figure 2 Expression levels and functions of miR-181a-2-3p in human gastric cancer clinical specimens. (A–C) miR-181a-2-3p expression was obviously increased in larger tumor size (≥5 cm; P= 0.0010) (A), higher T stage (T4; P= 0.0006) (B), and chemotherapy resistance (SD+PD; P< 0.0001) (C) in gastric cancer serum specimens. (D–F) miR-181a-2-3p expression was obviously increased in larger tumor size (≥5 cm; P= 0.0002) (D), higher T stage (T4; P= 0.0016) (E), and chemotherapy resistance (SD+PD; P< 0.0001) (F) in gastric cancer tumor samples. (G) A comparison between the serum specimen group (miR-181a-2-3pserum) and the tumor samples group (miR-181a-2-3ptumor) showed that the two compared areas were not significantly different (P= 0.708) by MedCalc software. (H) The compared areas of the combined two sample types group (miR-181a-2-3pserum + tumor) and the serum specimen group (miR-181a-2-3pserum) were significantly different (P= 0.011) by MedCalc software. (I) The compared areas of the combined two sample types group (miR-181a-2-3pserum + tumor) and the tumor samples group (miR-181a-2-3ptumor) were significantly different (P= 0.006) by MedCalc software.
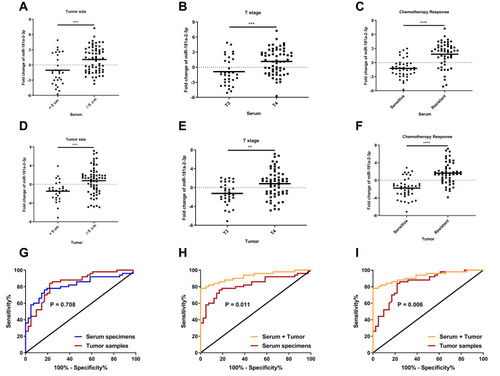
Figure 3 Bioinformatics analysis and validation of miR-181a-2-3p in gastric cancer. (A) Starbase database showed miR-181a-2-3p got a higher expression in 372 gastric cancer samples, compared with 32 gastric normal samples. (B) RT-qPCR results proved that miR-181a-2-3p was at a relatively high level in most human gastric cancer cell lines (AGS, SGC-7901, BGC-823 and MGC-803), compared with human gastric epithelial cell line GES-1. (C and D) Compared to adjacent non tumor tissue, miR-181a-2-3p presented a higher level in gastric cancer tissue. (E–H) GC patients with higher miR-181a-2-3p levels had obviously shorter 10-year overall survival (OS) times than those with lower miR-181a-2-3p levels in Kaplan–Meier Plotter database (P= 0.053) (E), OncoLnc database (P= 0.00506) (F), OncomiR database (P= 0.003906) (G), and Starbase database (P= 0.0045) (H).
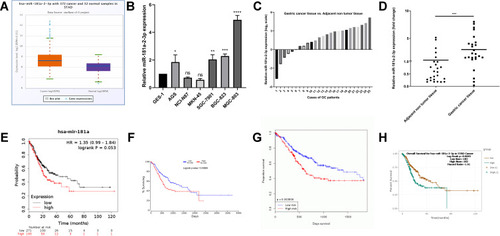
Figure 4 Overexpression of miR-181a-2-3p renders gastric cancer cells resistance to DDP. (A) RT-qPCR results confirm that miR-181a-2-3p level was significantly increased in SGC-7901 cells and MGC-803 cells transfected with miR-181a-2-3p mimics, compared with that in mimics control cells. (B) Cellular activity in SGC-7901 cells and MGC-803 cells transfected with miR-181a-2-3p mimics, compared with that in mimics control cells, was detected following treatment with various concentrations of DDP for 48 h. (C) SGC-7901 cells and MGC-803 cells transfected with the miR-181a-2-3p mimics showed marked increase in survival rates and higher DDP IC50 values, compared with the mimics control cells. (D) Higher levels of miR-181a-2-3p were associated with increased cell proliferation after 2 weeks of culture with 0.2 μg/mL DDP in SGC-7901 cells or 0.8 μg/mL DDP in MGC-803 cells. (E) Compared with the mimics control cells, the relative colony forming efficiency in both SGC-7901 cells and MGC-803 cells transfected with the miR-181a-2-3p mimics got a significant increase. (F and G) Compared with the mimics control cells, SGC-7901 cells and MGC-803 cells transfected with miR-181a-2-3p mimics exhibited decreased rates of apoptosis following culture with 0.2 μg/mL DDP and 0.8 μg/mL DDP for 48 h, respectively.
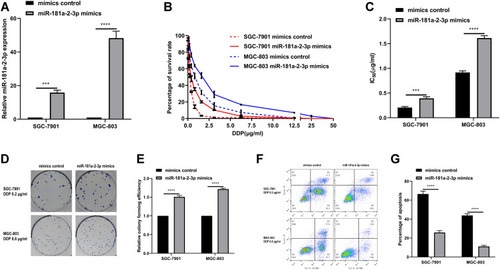
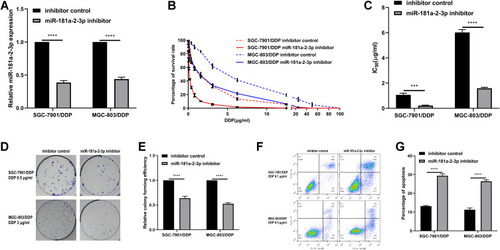
Figure 5 Downregulation of miR-181a-2-3p sensitizes gastric cancer cells to DDP. (A) RT-qPCR results confirm that miR-181a-2-3p level was markedly reduced in SGC-7901/DDP cells and MGC-803/DDP cells transfected with miR-181a-2-3p inhibitor, compared with that in inhibitor control cells. (B) SGC-7901/DDP cells and MGC-803/DDP cells transfected with either miR-181a-2-3p inhibitor or inhibitor control were treated with a range of DDP concentrations for 48 h, after which viability was assessed. (C) miR-181a-2-3p-knockdown in SGC-7901/DDP cells and MGC-803/DDP cells resulted in increased survival rates and higher DDP IC50 values, compared with the inhibitor control cells. (D and E) Following treatment with 0.5 μg/mL DDP in SGC-7901/DDP cells and 3 μg/mL DDP in MGC-803/DDP cells for 2 weeks, reduced levels of miR-181a-2-3p were also associated with decreased proliferation and colony formation. (F and G) Flow cytometric analysis revealed that after treatment with 0.1 μg/mL DDP in SGC-7901/DDP cells and 0.5 μg/mL DDP in MGC-803/DDP cells for 48 h, SGC-7901/DDP cells and MGC-803/DDP cells transfected with miR-181a-2-3p inhibitor exhibited increased apoptotic rate compared with the inhibitor control cells.