
Figures & data
Figure 1 Flow chart showing patient recruitment.
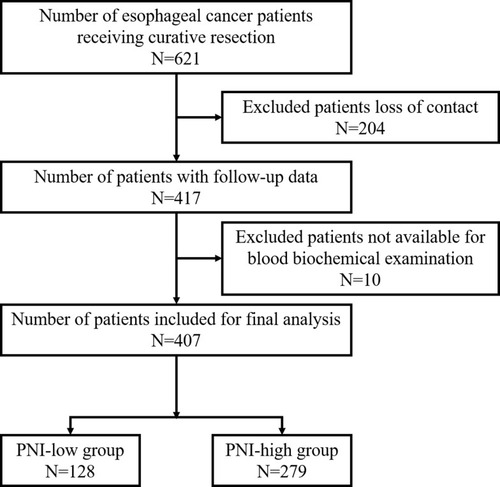
Table 1 Patients’ Characteristic
Figure 2 Kaplan–Meier survival curves for OS according to PNI, NLR, PLR and SII in esophageal cancer patients. The number at risk was shown below. (A) The PNI-low group showed a significantly shorter OS compared with the PNI-high group (34.38% VS 49.46%, log rank P < 0.001). (B) The NLR-high group showed a significantly shorter OS compared with the NLR-low group (36.13% VS 48.26%, log rank P = 0.026). (C) The PLR-high group showed a significantly shorter OS compared with the PLR-low group (33.33% VS 48.52%, log rank P = 0.001). (D) No significantly difference were found between OS in SII groups (46.31% VS 42.33%, log rank P = 0.067).
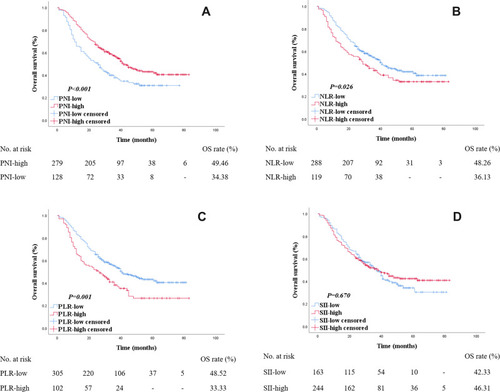
Table 2 Univariate and Multivariate Analyses of Prognostic Factors for OS
Table 3 Correlation of PNI NLR PLR SII with Postoperative Complications
Table 4 Univariate and Multivariate Logistic Analyses on the Occurrence of Complications