Figures & data
Figure 1 NBP represses proliferation of lung cancer cells. (A–F) The A549 and H1975 cells were treated with NBP. (A and B) The cell viability was measured by CCK-8 assays. (C and D) The cell proliferation was detected by colony formation assays. (E and F) The cell proliferation was analyzed by Edu assay. mean ± SD. **P < 0.01.
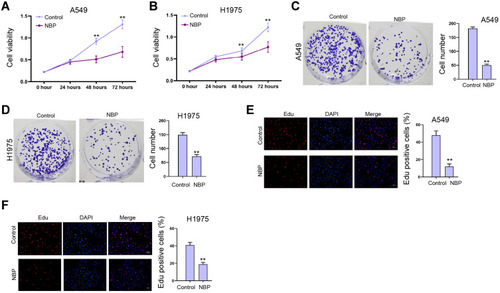
Figure 2 NBP inhibits lung cancer cell growth in vivo. (A–D) The nude mice were injected with A549 cells and treated with NBP. The cell growth of was analyzed by tumorigenicity analysis in the nude mice. (A) The tumor volume was calculated. (B) The tumor weight was calculated. (C) The levels of Ki-67 were detected by IHC. (D) The expression of PD-L1 was tested by IHC. N=5, mean ± SD. *P < 0.05, **P < 0.01.
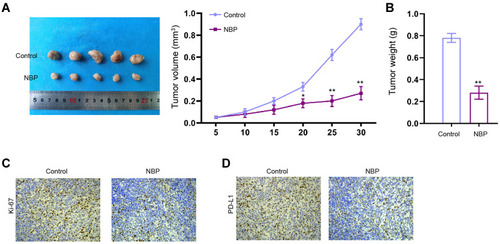
Figure 3 NBP reduces IFN-γ-induced PD-L1 enhancement in lung cancer cells. (A and B) The A549 and H1975 cells were treated with IFN-γ (200 ng/mL). The expression of PD-L1 was analyzed by fluorescence-activated cell sorting (FACS) in the cells. (C and D) The A549 and H1975 cells were treated with IFN-γ (200 ng/mL), or co-treated with IFN-γ (200 ng/mL) and NBP. The expression of PD-L1 was analyzed by FACS in the cells. (E) The expression of PD-L1 was determined by qPCR in A549 and H1975 cells treated with NBP. mean ± SD. **P < 0.01.
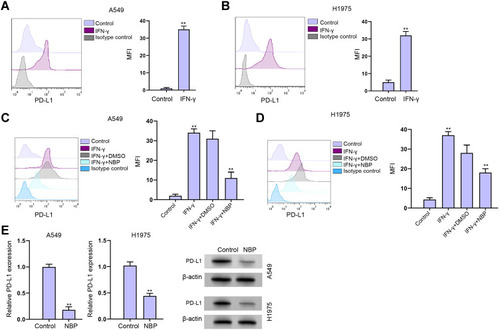
Figure 4 NBP stimulates T cells activity and proliferation to suppresses lung cancer cell survival. (A–E) The co-culture system was established by placing the unstimulated or activated T cells in upper chambers of the Transwell, and the A549 and H1975 cells in the lower chambers at a ratio of 1:10. (A) The expression of PD-L1 was analyzed by FACS in the cells. (B and C) The proportions of CD4+ PD-1+ and CD8+ PD-1+ T cell were determined by flow cytometry. (D) Expression of PD-L1 in A549 and H1975 cells cultured in conditioned medium from unstimulated or activated PBMCs. (E) T cell proliferation under co-cultured with A549 and H1975 cells was determined by CCK-8 assay. (F) T cell activity under co-cultured with A549 and H1975 cells was determined by flow cytometry detection of CD8+ T cells. (G) Apoptosis of T cells was determined by flow cytometry. mean ± SD. **P < 0.01.
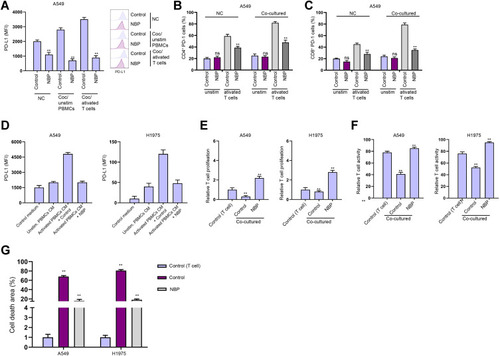
Figure 5 NBP suppresses PD-L1 expression in lung cancer cells through targeting KAT7. (A) The expression of KAT7 was analyzed by qPCR in A549 and H1975 cells treated with NBP. (B) The expression of KAT7 was determined by qPCR in A549 and H1975 cells treated with KAT7 shRNAs. (C) The expression of PD-L1 was determined by qPCR in A549 and H1975 cells treated with KAT7 shRNA. (D–F) The A549 and H1975 were cells treated with NBP. The enrichment of KAT7 (D), H3K14ac (E), and RNA pol II (F) on PD-L1 promoter was analyzed by ChIP assays. (G–I) The A549 and H1975 were cells treated with NBP. The enrichment of KAT7 (G) and H3K14ac (H), on PD-L1 promoter was analyzed by ChIP assays. (I) The expression of PD-L1 was determined by qPCR. (J) The expression of PD-L1 was detected by qPCR in A549 and H1975 cells treated with NBP or co-treated with NBP and KAT7 overexpressing plasmid. mean ± SD. **P < 0.01.
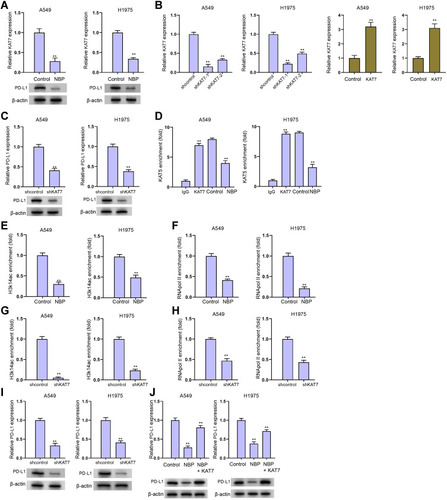
Figure 6 The depletion of KAT7 reduces proliferation of lung cancer cells. (A–F) The A549 and H1975 cells were treated with KAT7 shRNA. (A and B) The cell viability was measured by CCK-8 assays. (C and D) The cell proliferation was detected by colony formation assays. (E and F) The cell proliferation was analyzed by Edu assay. mean ± SD. **P < 0.01.
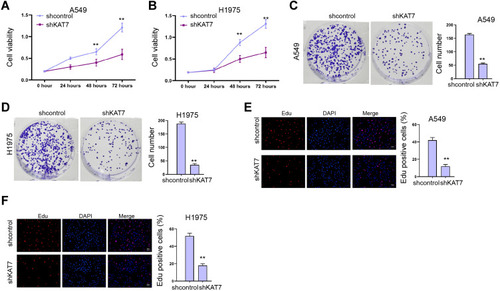
Figure 7 The depletion of KAT7 stimulates T cells activity and proliferation to suppresses lung cancer cell survival. (A–E) The co-culture system was established by placing the unstimulated or activated T cells in upper chambers of the Transwell, and the A549 and H1975 cells treated with KAT7 shRNA in the lower chambers at a ratio of 1:10. (A) The expression of PD-L1 was analyzed by FACS in the cells. (B and C) The proportions of CD4+ PD-1+ and CD8+ PD-1+ T cell were determined by flow cytometry. (D) Expression of PD-L1 in A549 and H1975 cells cultured in conditioned medium from unstimulated or activated PBMCs. (E) T cell proliferation under co-cultured with A549 and H1975 cells was determined by CCK-8 assay. (F) T cell activity under co-cultured with A549 and H1975 cells was determined by flow cytometry detection of CD8+ T cells. (G) Apoptosis of T cells was determined by flow cytometry. mean ± SD. *P < 0.05, **P < 0.01.
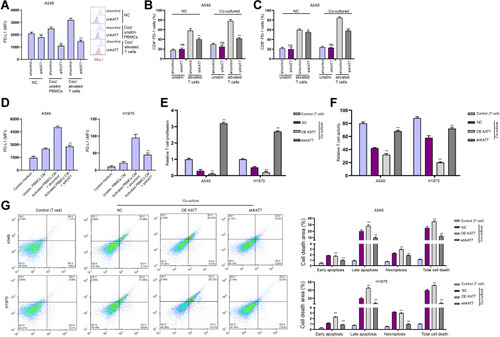
Figure 8 NBP reverses KAT7 overexpression-inhibited T cells activity and proliferation. (A–C) The co-culture system was established by placing the unstimulated or activated T cells in upper chambers of the Transwell, and the A549 and H1975 cells treated with KAT7 overexpressing plasmid or co-treated with NBP in the lower chambers at a ratio of 1:10. (A) T cell proliferation under co-cultured with A549 and H1975 cells was determined by CCK-8 assay. (B) T cell activity under co-cultured with A549 and H1975 cells was determined by flow cytometry detection of CD8+ T cells. (C) Apoptosis of T cells were determined by flow cytometry. mean ± SD. **P < 0.01.
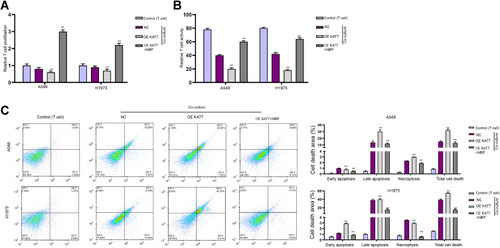
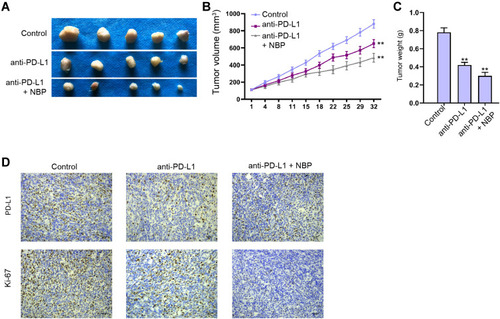
Figure 9 NBP improves anti-PD-L1 immunotherapy against lung cancer cell growth in vivo. (A–D) C57BL/6 mice were subcutaneously injected with murine Lewis lung cancer (LLC) cells. The mice accepted injection of the anti PD-L1 monoclonal antibody, or co-treated with anti PD-L1 monoclonal antibody and NBP. (A) The tumor images were shown. (B) The tumor volume was calculated. (C) The tumor weight was calculated. (D) The levels of Ki-67 and PD-L1 were detected by IHC. N=5, mean ± SD. **P < 0.01.