Figures & data
Figure 1 Heterogeneous morphology, MMR protein expression and PD-L1 expression patterns of the 2 synchronous rectal tumours (masses A and B) in the LS patient. (A and G) HE staining of masses A and B showing the classic protruding pattern of adenocarcinoma growth. The IHC staining of mass A showed intact expression of MLH1 (B), PMS2 (C), MSH2 (D), and PD-L1 (F) in addition to loss of expression of MSH6 (E). Mass #B showed intact expression of MLH1 (H), PMS2 (I), MSH2 (J), MSH6 (K) and PD-L1 (L). All images were collected at 100× magnification.
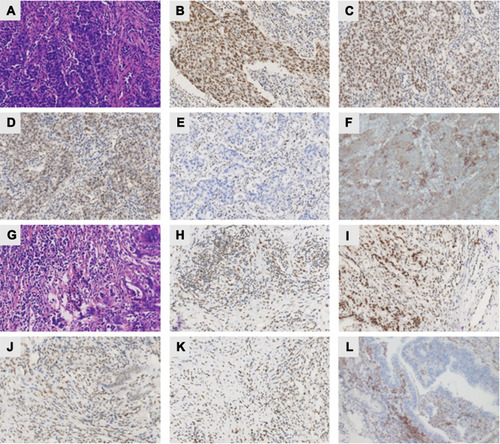
Figure 2 The patient’s pedigree. The proband had rectal cancer and carried the MSH6 p.R495* germline mutation. Similarly, the individuals (the patient’s mother and the patient’s brother) without cancers carried the MSH6 p.R495* germline mutation. One of the patient’s uncles had colon cancer but did not undergo NGS assessment.
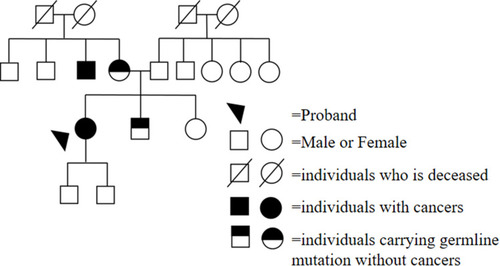
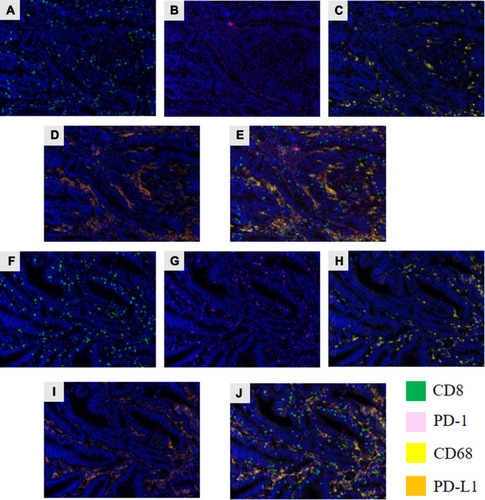
Figure 3 Assessment of the TIME via multiplex IHC (mIHC). (A and F) The green fluorescence indicates CD8+ T cells. (B and G) The pink fluorescence indicates PD-1 expression. (C and H) The yellow fluorescence indicates CD68 expression. (D and I) The Orange fluorescence indicates PD-L1 expression. (E and J) The pictures show all layers merged.