
Figures & data
Table 1 Patients’ Characteristics
Table 2 Changes in the Relative Eosinophil Count and Neutrophil-to-Eosinophil Ratio Before and Three Weeks After Pembrolizumab
Figure 1 The overall survival in patients treated with pembrolizumab according to the pretreatment relative eosinophil count and neutrophil-to-eosinophil ratio. *P values are reported.
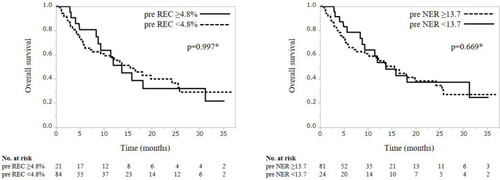
Figure 2 The overall survival in patients treated with pembrolizumab according to the change of relative eosinophil count and neutrophil-to-eosinophil ratio at three weeks after pembrolizumab. *P values are reported.
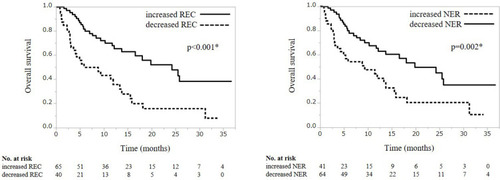
Table 3 The Univariate and Multivariate Analyses of the Factors Associated with the Overalls Survival in Patients Receiving Pembrolizumab Treatment