
Figures & data
Table 1 General Data of Patients in Two Groups [n(%)] (Mean±SD)
Figure 1 Comparison of serum tumor markers between two groups before and after treatment. (A) There was no difference in CEA expression between the two groups before treatment, but CEA in the research group was significantly lower than that in the control group after treatment. (B) There was no difference in CA125 expression between the two groups before treatment, but CA125 in the research group was significantly lower than that in the control group after treatment. (C) There was no difference in CA15-3 expression between the two groups before treatment, but CA15-3 expression in the research group was significantly lower than that in the control group after treatment.
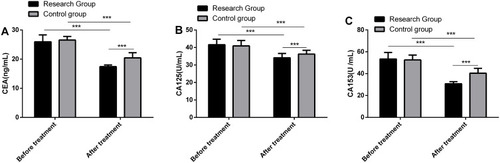
Figure 2 Comparison of inflammatory factors between two groups before and after treatment. (A) There was no difference in CRP expression between the two groups before treatment, but CRP in the research group was significantly lower than that in the control group after treatment. (B) There was no difference in TNF-α expression between the two groups before treatment, but TNF-α expression in the research group was significantly lower than that in the control group after treatment.
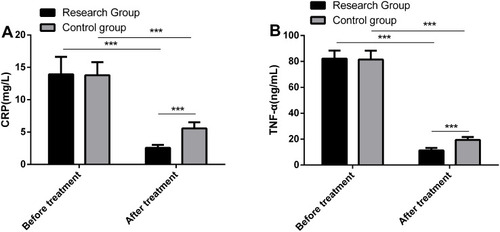
Table 2 Comparison of Curative Effects Between Two Groups After Treatment [n(%)]
Table 3 Incidence of Adverse Reactions in Two Groups During Treatment [n(%)]
Table 4 Comparison of Quality of Life Scores Between Two Groups Before and After Treatment (Mean±SD)
Table 5 Variable Assignment Table of Unconditional Logistic Regression Analysis
Table 6 Multivariate Analysis of Factors Influencing the Curative Effect of Patients with HER-2+ Breast Cancer