Figures & data
Figure 1 Flow chart of the data selection process.
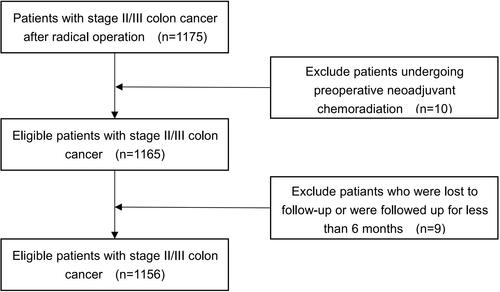
Table 1 Baseline Characteristics of Participants
Table 2 Results of Univariate and Multivariate Cox Regression Model
Figure 2 The model resolution of the three models in the modeling set. (A) The modeling set; (B) The verification set, and AUC represents the area under the ROC curve.
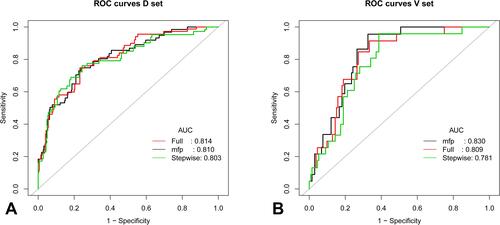
Figure 3 Calibration for AIC-stepwise model. (A) Predicting the calibration curve of the patient’s 3-year overall survival; (B) Predicting the calibration curve of the patient’s 5-year overall survival.
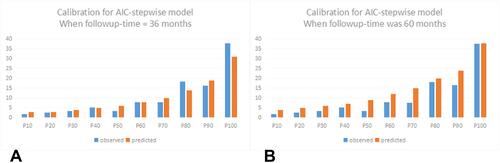
Figure 4 The clinical decision curves of the three models basically coincide.
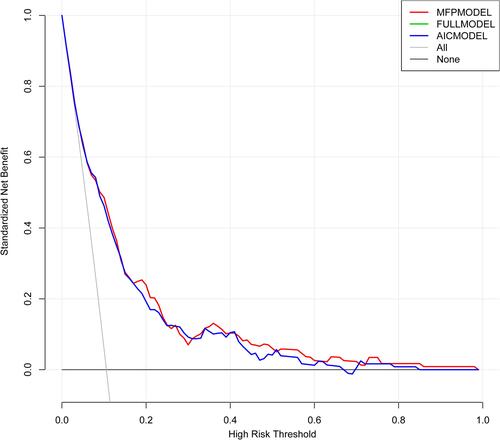
Figure 5 Nomogram for predicting 3 years (A) and 5 years (B) overall survival of patients in stage II/III colon cancer. In N stage, 0 means N0, 1 means N1, 2 means N2; in differentiation, 1 means high/medium differentiation, 2 means low differentiation; in postoperative chemotherapy, 1 means that postoperative chemotherapy has been performed, 2 means no postoperative chemotherapy.
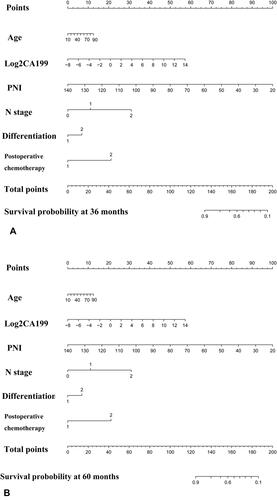
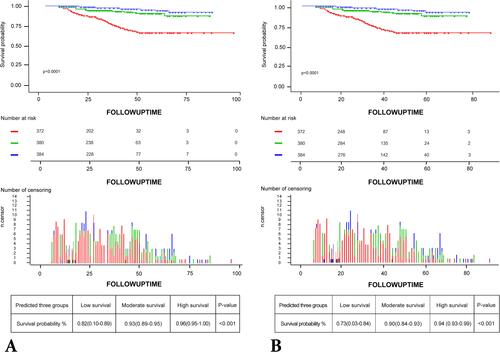
Figure 6 Draw the Kaplan-Meier curve of risk group stratification for overall survival. (A) In the 3-year overall survival Kaplan-Meier curve: 96% overall survival in the low-risk group, 93% overall survival in the middle-risk group, 82% overall survival in the high-risk group; (B) In the 5-year overall survival Kaplan-Meier curve: 94% overall survival in the low-risk group, 90% overall survival in the middle-risk group, 73% overall survival in the high-risk group; all curves show statistical differences. The blue line indicates low risk, the green line indicates medium risk, the red line indicates high risk.