Figures & data
Table 1 Information of Clinical Characteristics for Study Subjects
Table 2 53 Differential Lipids Between NR and CAA Groups in Both ESI Modes
Figure 1 The TIC chromatography of normal (NR) and colorectal advanced adenoma (CAA) groups in both ESI modes. (A and B) TIC chromatography of NR in ESI+ and ESI- modes, respectively; (C and D) TIC chromatography of CAA in ESI+ and ESI- modes, respectively.
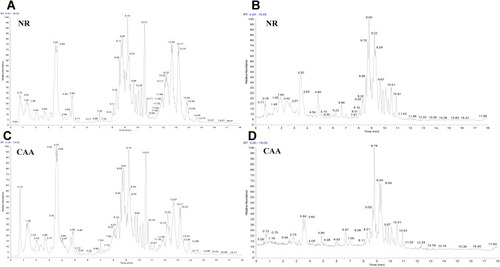
Figure 2 Multivariate statistical analysis for lipid profile between the NR and CAA groups. (A and B) 3D PCA analysis of the two groups in ESI+ and ESI- modes, respectively; (C and D) 3D OPLS-DA analysis of the two groups in ESI+ and ESI- modes, respectively. R2X[cum] = 0.379 and 0.522, R2Y[cum] = 0.981 and 0.951, Q2[cum] = 0.976 and 0.870; (E and F) Permutation test (200 permutations) corresponding to OPLS-DA model in ESI+ and ESI- modes, respectively.
![Figure 2 Multivariate statistical analysis for lipid profile between the NR and CAA groups. (A and B) 3D PCA analysis of the two groups in ESI+ and ESI- modes, respectively; (C and D) 3D OPLS-DA analysis of the two groups in ESI+ and ESI- modes, respectively. R2X[cum] = 0.379 and 0.522, R2Y[cum] = 0.981 and 0.951, Q2[cum] = 0.976 and 0.870; (E and F) Permutation test (200 permutations) corresponding to OPLS-DA model in ESI+ and ESI- modes, respectively.](/cms/asset/9ba2d3f6-8c8e-4d14-81ce-5ba19ea0ab31/dcmr_a_12190012_f0002_c.jpg)
Figure 3 The proportion of differential lipids between two groups.
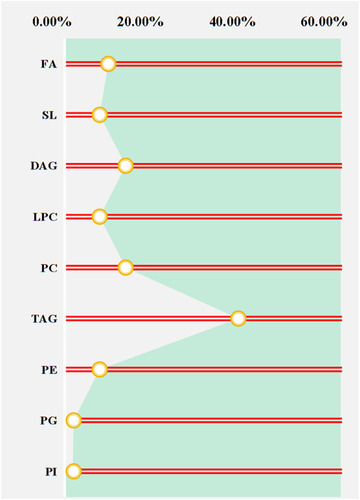
Figure 4 Heat map analysis of 53 differential lipids between NR and CAA groups. The color bars represent the log10 value of the ratio for each lipid species and only statistically significant changes are shown (VIP > 1, P < 0.05).
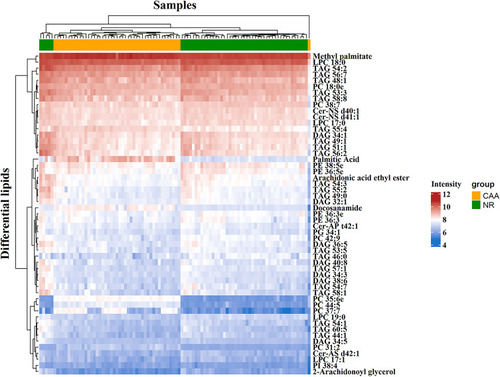
Figure 5 Normalization of the differential lipids between the NR and CAA groups. (A and B) Sample normalization of two groups in ESI+ and ESI- modes, respectively; (C and D) Lipids normalization of two groups in ESI+ and ESI- modes, respectively.
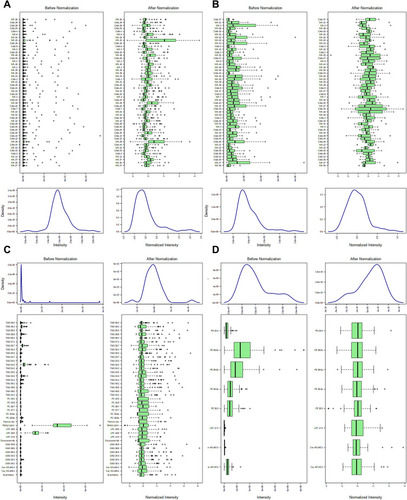
Figure 6 Performance evaluation of differential lipids between NR and CAA groups. (A) PC 35:6e; (B) PC 44:5; (C) Palmitic acid; (D) PC 31:2; (E) PC 37:7; (F) PC 42:9; (G) PC 18:0e; (H) TAG 57:1; (I) Methyl palmitate; (J) LPC 18:0; (K) LPC 17:0; (L) Docosanamide.
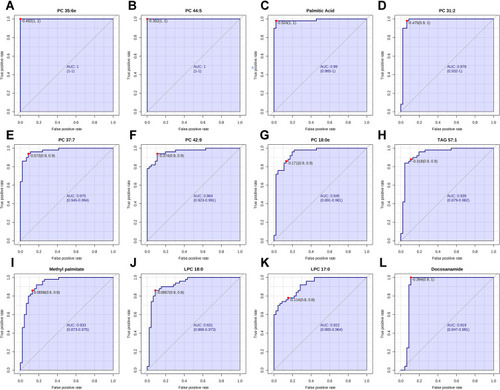
Figure 7 The identification of 12 differential lipids with good diagnosis between NR and CAA groups. (A) PC 35:6e; (B) PC 44:5; (C) Palmitic acid; (D) PC 31:2; (E) PC 37:7; (F) PC 42:9; (G) PC 18:0e; (H) TAG 57:1; (I) TAG 57:1; (J) Methyl palmitate; (K) LPC 18:0; (L) LPC 17:0; (M) Docosanamide.
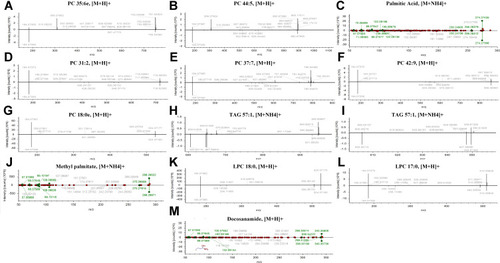
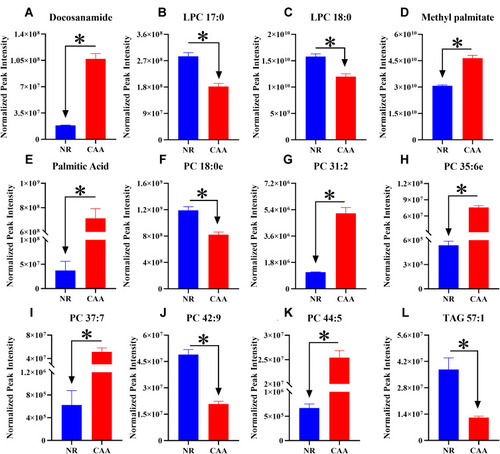
Figure 8 The trend of differential lipids in NR and CAA groups. (A) Docosanamide; (B) LPC 17:0; (C) LPC 18:0; (D) Methyl palmitate; (E) Palmitic Acid; (F) PC 18:0e; (G) PC 31:2; (H) PC 35:6e; (I) PC 37:7; (J) PC 42:9; (K) PC 44:5; (L) TAG 57:1. *Means the significant difference of levels of differential lipid between NR and CAA. The levels of differential lipids were displayed with mean ± SEM.