Figures & data
Table 1 Baseline Characteristics of 2003 Patients with Nasopharyngeal Carcinoma
Table 2 Baseline Characteristics of Nasopharyngeal Carcinoma Patients with or without Metabolic Syndrome
Figure 1 Kaplan–Meier curve analysis of survival probabilities of NPC patients stratified by metabolic syndrome. (A) Progression-free survival. (B) Cancer specific survival. (C) Overall survival.
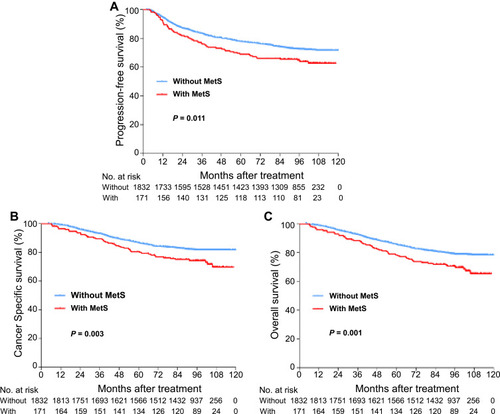
Table 3 Univariate Analysis of Prognostic Factors in Patients with Nasopharyngeal Carcinoma
Table 4 Multivariable Analysis of Prognostic Factors in Patients with Nasopharyngeal Carcinoma
Figure 2 Metabolic profile analysis of NPC patients with and without metabolic syndrome. (A) Partial least-squares discrimination analysis (PLS-DA) of the serum metabolomic file of NPC patients in the MetS and NMetS groups (n = 5). Each symbol represents the data of an individual patient. (B) Fold change analysis discovering differential serum metabolites, which were identified with a log2 (FC) of MetS/NMetS > 1 or < −1. (C) Heatmap showing the top 50 differential serum metabolites. Differential serum metabolites were identified with p<0.05 using Student’s t-test.
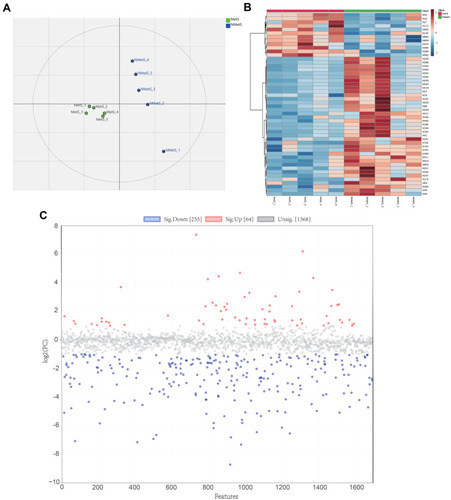
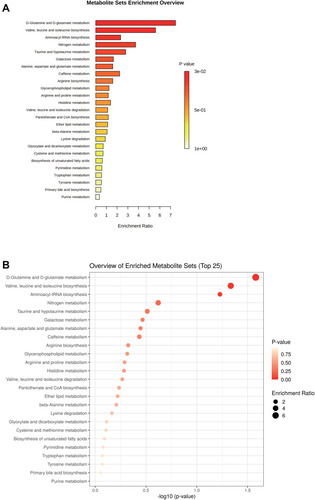
Figure 3 Enrichment and pathway analysis of differential metabolites. (A) Bar plot of KEGG pathway analysis of differential metabolites; (B) dot plot of KEGG pathway analysis of differential metabolites.