Figures & data
Table 1 Clinical Parameters of Study Cohort 1 and 2
Table 2 Characteristics of Biopsy GS6 Patients With or Without Gleason Upgrading Upon Subsequent RP in Cohort 3
Figure 1 Relative expression of selected miRNAs between the Gleason Patterns 3, 4 and 5. Differential expression of selected miRNAs in tumor tissues of each GP (GP3: n=29, GP4: n=44, and GP5: n=16, respectively) compared to adjacent normal tissues (n=53) as measured by RT-PCR. Only the statistically significant comparisons were noted by asterisks. *P<0.05; **P<0.01; ***P<0.001; ****P<0.0001.
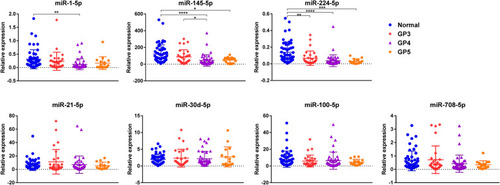
Figure 2 Relative expression of selected miRNAs in GP3 cancer tissues from pure GS 6 tumors and GS 7 tumors using cohort 1. Differential expression of selected miRNAs in GP3 cancer tissues from pure GS 6 tumors (n=9) and GS 7 tumors (either 4+3 or 3+4, n=20) using patient set 1. * P<0.05.
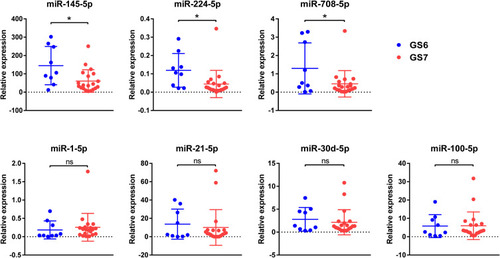
Figure 3 Validation of the expression of selected miRNAs in prostate cancer biopsy samples. Validation of the expression of selected miRNAs in prostate cancer biopsy samples. Scatter diagrams representing the tissue expression level of three miRNAs in GP3 from 107 FFPE PCa biopsy samples. We detected significant decrease in the expression of miR-145-5p in GP3 areas from pure GS6 tumors (n=32) as compared to GP3 areas from GS7 (either 4+3 or 3+4, n=75). ***P<0.001.
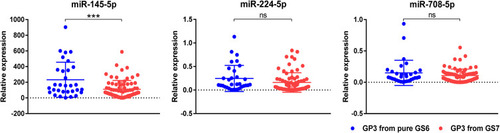
Table 3 Multivariate Analysis of Predictors for Gleason Upgrading in Cohort 3
Figure 4 Association between the expression level of miR-145-5p and Gleason upgrading (GU) of biopsy samples scored GS6. (A) Differential expression of miR-145-5p in GS6 biopsy samples with GU in the following RP relative to those with GNU. (B) Receiver operating characteristic curve for miR-145-5p. **** P<0.0001.
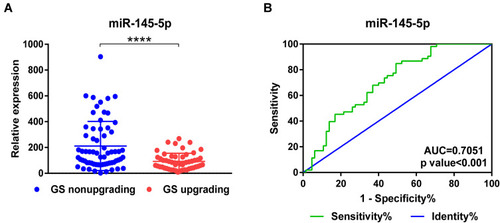
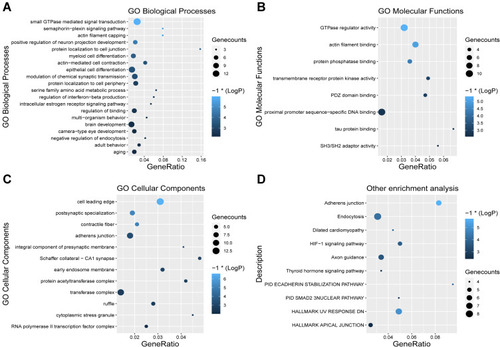
Figure 5 Gene ontology (GO) annotation and KEGG pathway enrichment analysis of predicted target genes of miR-145-5p. GO and KEGG analysis results. Terms with p < 0.01 were visualized as a bubble plot, as the more genes included, the bigger the size. Lighter colors indicate smaller P-values. (A) Enriched terms of GO biological process (BPs). (B) Enriched terms of GO molecular functions (MFs). (C) Enriched terms of GO cellular compounds (CCs). (D) Enriched terms of KEGG pathway, Canonical Pathways and Hallmark.