Figures & data
Figure 1 (A) CT image at the umbilical level. (B) The red part shows the total fat area (TFA). (C) The red part shows the subcutaneous fat area (SFA). (D) The red part shows the visceral fat area (VFA).
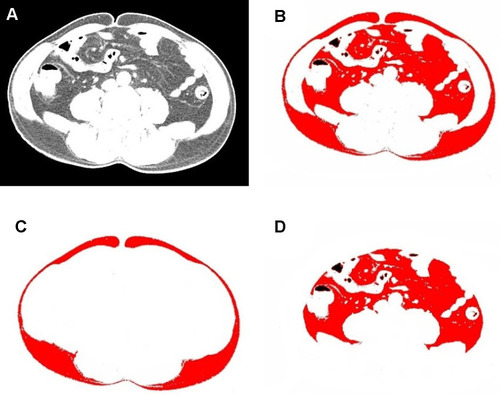
Table 1 The Clinical Data of the Patients
Figure 2 (A) Student’s t-test showed a significant correlation between VFA and sex (P<0.001). (B) Pearson’s test showed that VFA was significantly associated with age (r=0.222, P<0.001).
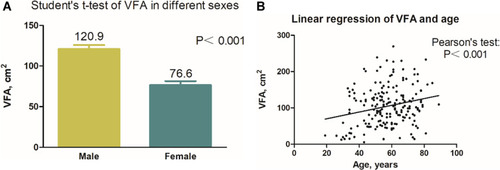
Table 2 Univariate Analysis of Predictors for Distinguishing ccRCC from RMFAML
Figure 3 (A) Pearson’s test showed that BMI was linearly correlated with VFA (r=0.635, P<0.001), SFA (r=0.596, P<0.001), and TFA (r=0.730, P<0.001). (B) Pearson’s test showed that VFA was linearly correlated with SFA (r=0.826, P<0.001) and TFA (r=0.417, P<0.001). (C) Pearson’s test showed that TFA was linearly correlated with SFA (r=0.857, P<0.001).
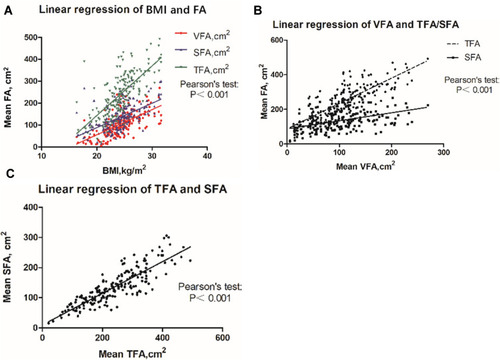
Table 3 Multivariate Analysis of Predictors for Distinguishing ccRCC from RMFAML
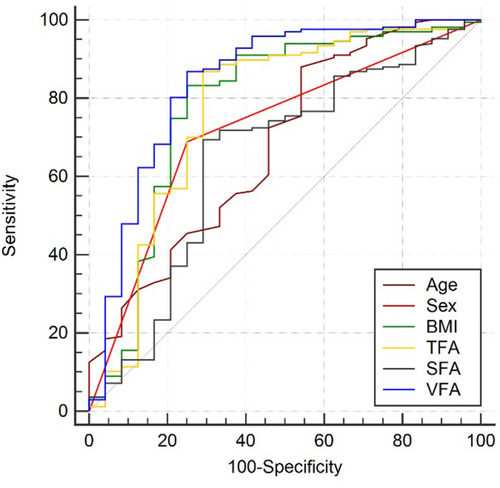
Figure 4 ROC curves of ccRCC vs RMFAML. The blue line represents VFA, the green line represents BMI, the Orange line represents TFA, the red line represents sex, the black line represents SFA, and the crimson line represents age.