
Figures & data
Table 1 Clinical Characteristics of the Early ESCC, EBL and HC Groups
Figure 1 IHC staining of CST1 in ESCC tissue and paracancerous tissue (×400). (A) Strong expression of CST1 with 3+ staining in ESCC tissue. (B) Negative expression of CST1 in paracancerous tissue.
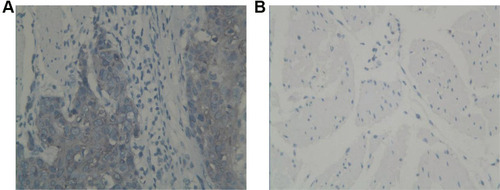
Table 2 Detection Limit of CLEIA for CST1
Figure 2 Standard curve for CLEIA. The RLU value is the mean of each diluted level detected twice; C is the diluted level (pg/mL) of CST1 calibrator. The same base logarithms of RLU and C are taken as X and Y axis, respectively, to draw the curve.
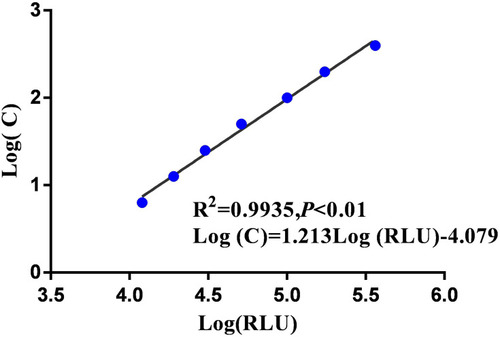
Table 3 Accuracy Evaluation of CLEIA for CST1
Table 4 Precision Evaluation of CLEIA for CST1
Table 5 Evaluation of Anti-Interference Ability of CLEIA for CST1
Figure 3 Line chart of quantitative detection results for low, medium and high levels of the serum samples stored at 4 °C and 25°C for eight time points. (A) The quantitative detection results of the low, medium and high levels of the serum samples stored at 4 °C for 0, 1, 2, 3, 4, 5, 6 and 7 d. (B) The quantitative detection results of the low, medium and high levels of the serum samples stored at 25 °C for 0, 1, 2, 3, 4, 5, 6 and 7 d.
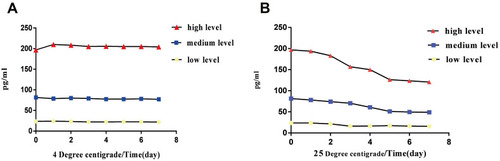
Figure 4 Line chart of quantitative detection results for CST1 calibrators and serum samples by the reagents stored at 25 °C and 37 °C for five time points. The quantitative detection results of the reagents stored at 25 °C for 0, 1, 3, 5 and 7 d are presented in (A) and (B). The quantitative detection results of the reagents stored at 37 °C for 0, 1, 3, 5 and 7 d are presented in (C) and (D).
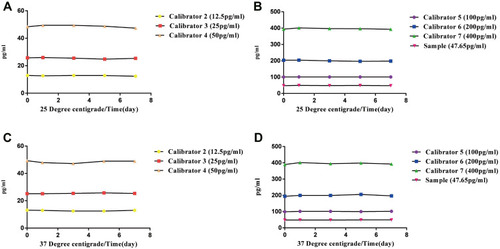
Figure 5 Histogram of quantitative detection results for CST1 by three batches reagents stored at 4 °C for four time points. The quantitative detection results for CST1 calibrator 2 (12.5 pg/mL), 3 (25 pg/mL), 4 (50 pg/mL), 5 (100 pg/mL), 6 (200 pg/mL), 7 (400 pg/mL) and serum sample by three batches reagents are presented in (A–G), respectively.
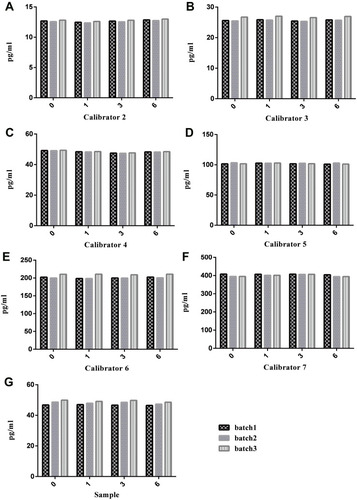
Figure 6 Diagnostic performances of serum CST1 and three traditional tumor markers CEA, CYFRA21-1, and SCC-Ag for early ESCC patients. Boxplot, scatter and ROC curve for CST1 (A) CEA (B) CYFRA21-1 (C) and SCC-Ag (D). (E) ROC curve for an optimal panel of CST1 with CEA and SCC-Ag. *Compared with the early ESCC group, P<0.05.
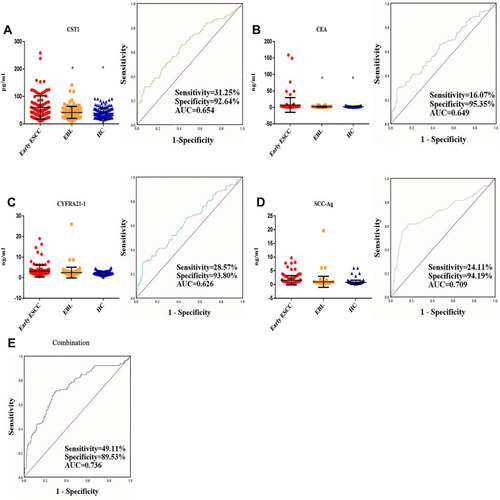
Table 6 Comparison of Different Combinations of Serum CST1 and Three Traditional Tumor Markers for Early Diagnosis of ESCC Patients