Figures & data
Table 1 Baseline Characteristics
Figure 1 Pie chart for histologic diagnosis. (A) Soft tissue sarcoma. (B) Bone sarcoma.
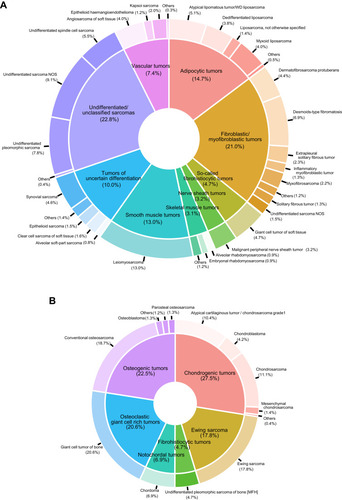
Figure 2 Sankey diagram showing sequential treatment flow of the study population. (A) Soft tissue sarcoma. (B) Bone sarcoma.
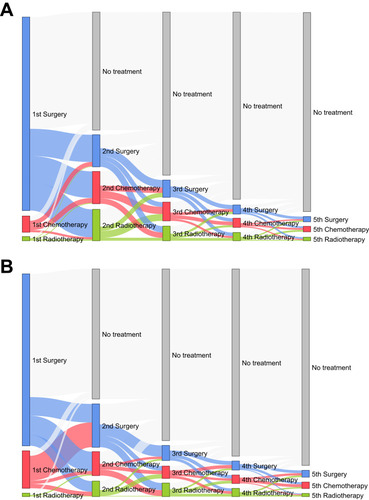
Figure 3 Initial treatment pattern by year of diagnosis.
Note: Straight lines and dotted lines indicate soft tissue and bone sarcomas, respectively.
Abbreviations: CT, chemotherapy; OP, surgery; RT, radiotherapy.
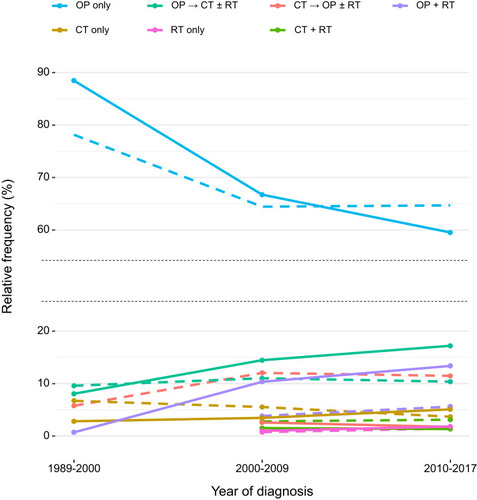
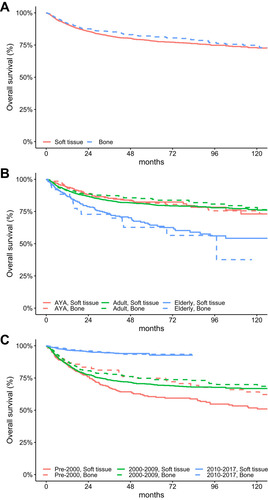
Figure 4 Overall survival by (A) origin of tumors, (B) age at diagnosis, and (C) year of diagnosis.
Abbreviations: AYA, adolescents and young adults; GU/GYN, genitourinary and gynecologic.