
Figures & data
Figure 1 Enrollment diagram of the retrospective study. Flow chart shows the number of patients who were eligible, enrolled into the study and included in the final analysis. ECOG, Eastern Cooperative Oncology Group.
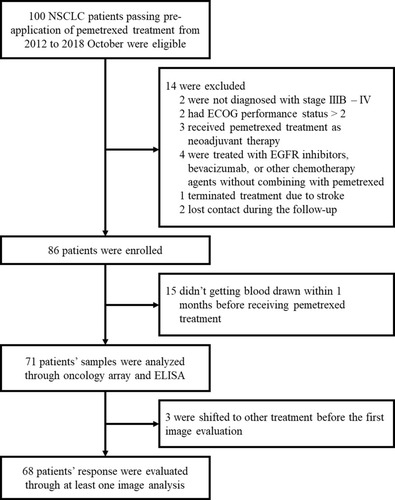
Figure 2 Different oncology-related protein expression levels between pemetrexed-based therapy responders and nonresponders. Plasma samples at baseline collected from (A) 3 responders (Nos. 15, 17 and 20) and (B) 3 nonresponders (Nos. 24, 27 and 34) analyzed through a human oncology array. Black frames present evident expression differences of specific proteins. (C) Spot intensity quantified using positive control spots (the “0” place) as references. The intensity of 12 proteins in responders and nonresponders with obvious differences were analyzed through unpaired t test. *p < 0.05.
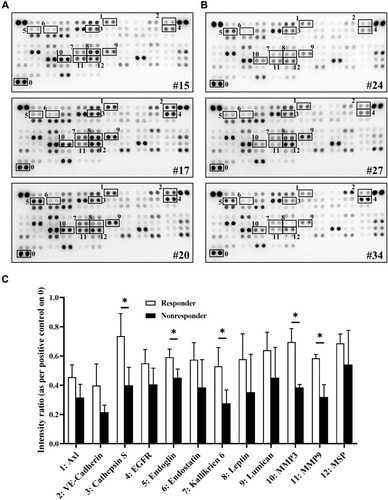
Figure 3 Effects of soluble endoglin, cathepsin S, matrix metalloproteinase 3 and 9 (MMP3 and MMP9) levels on pemetrexed-based chemotherapy responsiveness in the cohort. (A–D) Soluble endoglin, cathepsin S, MMP3 and MMP9 concentration (ng/mL) in responders and nonresponders before the treatment were measured using enzyme-linked immunosorbent assay. The levels of these 4 proteins in responders and nonresponders were compared through unpaired t test. **p < 0.01. (E) Response distribution of high and low endoglin groups on day 120. (F) Waterfall plot of included patients with at least one clinical image record. a, death. b, pemetrexed intolerance. c, distant progression disease. d, effusion accumulation.
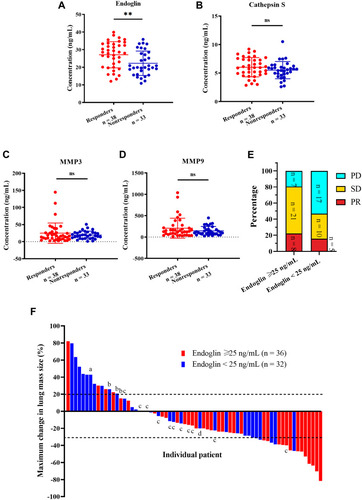
Figure 4 Level change of soluble endoglin before and after pemetrexed-based therapy in pemetrexed responders. Soluble endoglin concentration in plasma samples of pemetrexed responders at baseline and the time of best response were measured using enzyme-linked immunosorbent assay and analyzed through paired t test. *p < 0.05.
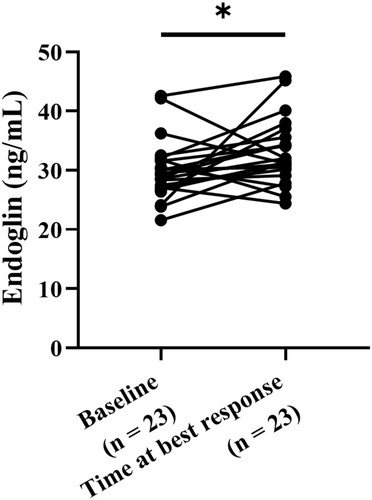
Figure 5 Effects of soluble endoglin, cathepsin S, matrix metalloproteinase 3 and 9 (MMP3 and MMP9) levels on progression-free survival and overall survival. (A–D) Progression-free survival of high- and low groups of endoglin, cathepsin S, MMP3 and MMP9 were analyzed using the Kaplan–Meier method and the log rank test. **p < 0.01. (E) Overall survival of the high- and low-endoglin groups were analyzed using the Kaplan–Meier method and the log rank test. *p < 0.05.
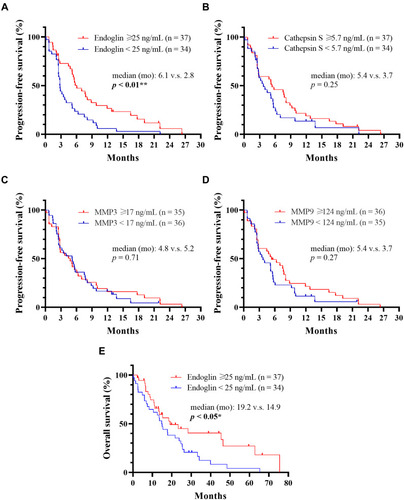
Table 1 Correlation of Pemetrexed-Based Therapy Responsiveness and Clinical, Pathological Factors, and Endoglin Level
Table 2 Univariate and Multivariate Analysis of All Patients with Non-Small Cell Lung Cancer and Treated with Pemetrexed-Based Treatment