Figures & data
Figure 1 Mining of m6A-related lung cancer prognostic lncRNAs. (A) Interaction network of m6A genes and lncRNA. (B) m6A-related lung cancer prognostic lncRNAs. (C–P) Survival of ABALON, AC007613.1, AC087501.4, AC034102.8, AC009690.2, AC099850.4, AC104785.1, AL031666.1, AC135050.6, AL096701.3, SALRNA1, MIR99AHG and UGDH.AS1.
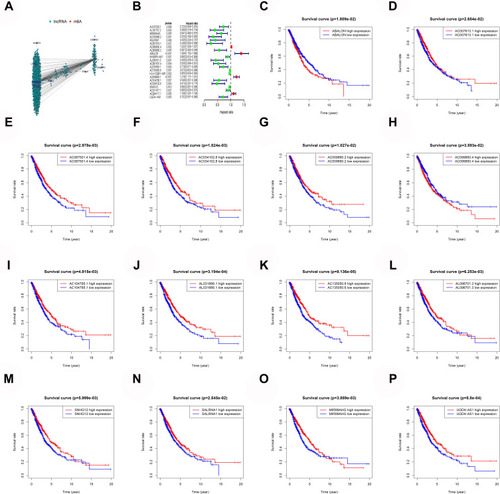
Figure 2 Construction and verification of prognostic risk model. (A and B) Least absolute shrinkage and selection operator (LASSO) regression determines the minimum criteria. (C) Coefficients of selected lncRNAs. (D) Kaplan–Meier curves showed that the high-risk group had worse overall survival than the low-risk group in the train group. (E) The AUC values of the 1-, 3-, and 5-year ROC curves of the train group are all greater than 0.6, indicating that the model has good prediction accuracy. (F) Distributions of risk scores and survival status of lung cancer patients in the train group. (G) Kaplan–Meier curves showed that the high-risk group had worse overall survival than the low-risk group in the test group. (H) The AUC values of the 1-, 3-, and 5-year ROC curves of the test group are all greater than 0.6, indicating that the model has good prediction accuracy. (I) Distributions of risk scores and survival status of lung cancer patients in the test group.
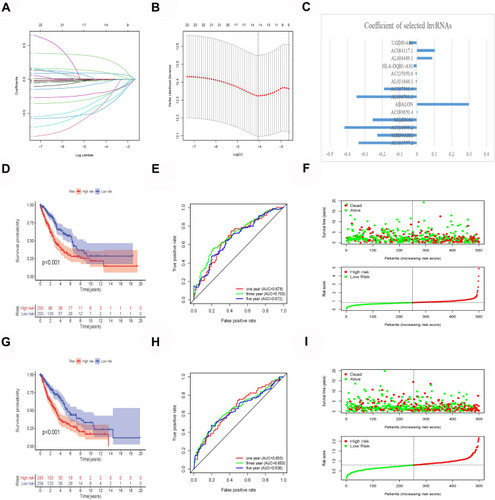
Figure 3 Cluster analysis. (A–G) The clustering graphs of 2–8 cluster. (H) Clustering index graphs. (I) Kaplan-Meier survival curves show cluster 1 had worse overall survival.
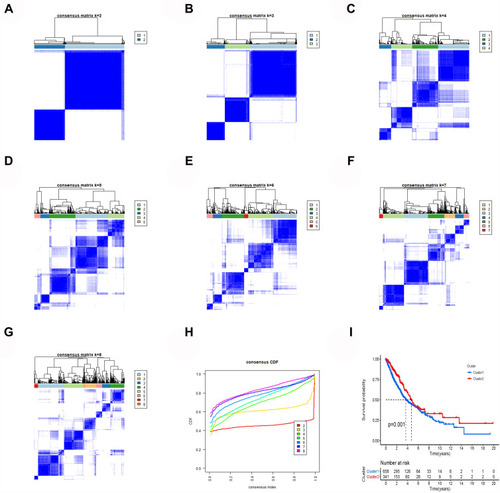
Figure 4 Gene set enrichment analysis. (A) Cell cycle. (B) DNA replication. (C) Homologous recombination. (D) Nucleotide excision repair. (E) Oocyte meiosis. (F) Proteasome. (G) Pyrimidine metabolism. (H) RNA degradation. (I) Spliceosome.
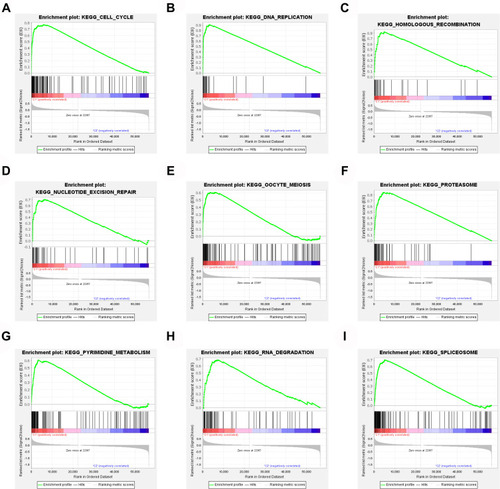
Figure 5 Immune infiltration and tumor microenvironment. (A) The expression of 22 immune cells between cluster 1 and cluster 2. (B) The immuneScore (C) stromalScore (D) eSTIMATEScore indicating that cluster 1 had a worse overall survival than cluster 2.
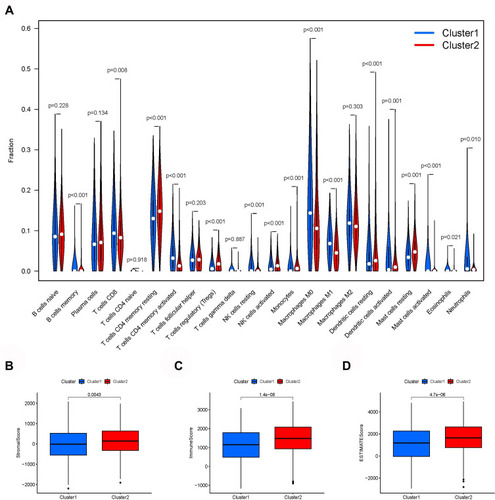
Figure 6 Correlation analysis showed that 14 kinds of immune cells are significantly related to the risk score of lung cancer patients. (A) B cells memory. (B) B cells naive. (C) Dendritic cells resting. (D) Eosinophils. (E) Macrophages M0. (F) Macrophages M2. (G) Mast cells activated. (H) Mast cells resting. (I) Neutrophils. (J) NK cells resting. (K) Plasma cells. (L) T cells CD4 memory activated. (M) T cells follicular helper. (N) T cells regulatory (Tregs).
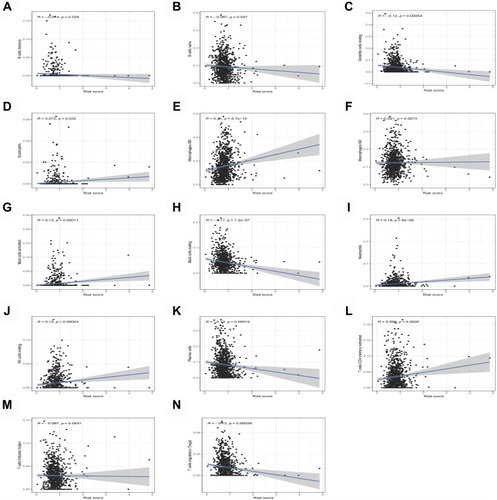
Figure 7 Model lncRNA differential expression. (A) AC099850.4, SNHG12, ABALON, AC084117.1, AC009690.2 and AL096701.3 were significantly high expression in lung cancer patients. (B) AC099850.4 and ABALON were significantly highly expressed in cluster 1. (C) AC099850.4, ABALON, AL606489.1 and AC084117.1 were highly expressed in high-risk group.
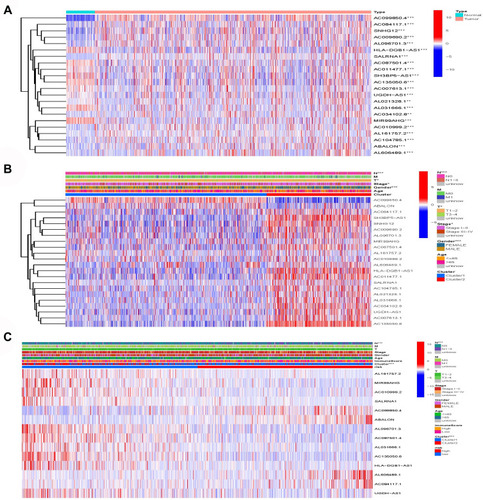
Figure 8 Subcellular localization and target prediction of lncRNA ABALON. (A) The subcellular localization results show that ABALON is mainly enriched in Cytosol. (B) The miRDB results showed that 40 miRNAs can bind to ABALON. (C) VWA1, MIEF1, NOB1, CCDC71L, FN3K, UBE2G1 and ELAVL are the target genes of miR-139-3p. (D) miR-486-5p, miR-4732-3p, miR-144-5p, miR-451, miR-139-3p, miR-144-3p, miR-30c-2-3p, miR-490-3p, miR-30a-3p, miR-133b, miR-30a-5p, miR-1-3p, miR-194-3p, miR-133a-3p, miR-143-3p, miR-206, miR-195-5p, miR-139-5p, miR-338-5p, miR-218-1-3p, miR-218-5p, miR-4529-3p and miR-190a-5p were highly expressed in lung cancer normal patients.
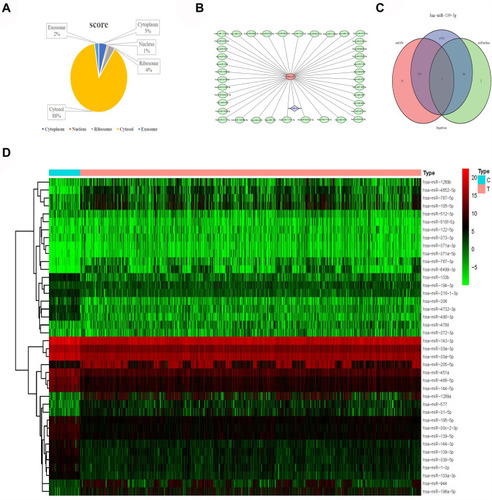
Figure 9 Differential expression and survival analysis of target genes. (A–G) The expression of CCDC71L, ELAVL, FN3K, MIEF1, NOB1, UBE2G1, VWA1 between lung cancer samples and normal samples. (H–N) Kaplan-Meier survival curves of CCDC71L, ELAVL, FN3K, MIEF1, NOB1, UBE2G1, VWA1 between lung cancer samples and normal samples. (O) ABALON-miR-139-3p-NOB1 base complementary binding situation.
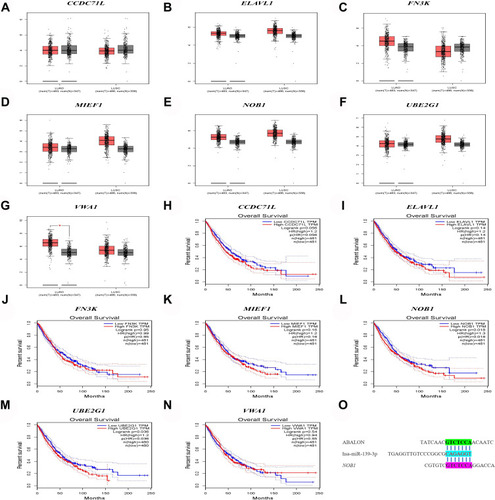
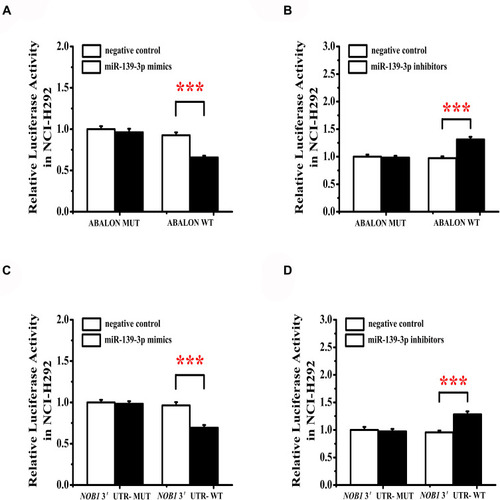
Figure 10 miR-139-3p targets ABALON and NOB1. (A) MiR-139-3p mimics target binding and reduce ABALON expression. (B) MiR-139-3p inhibitors can increase the activity of ABALON. (C) MiR-139-3p mimics target binding and reduce NOB1 expression. (D) MiR-139-3p inhibitors can increase the activity of NOB1. ***<0.001.