Figures & data
Table 1 Statistics of the Three Microarray Datasets Selected from the Gene Expression Omnibus Database
Figure 1 Venn diagrams of DEGs common to three Gene Expression Omnibus datasets. (A) Total DEGs; (B) upregulated DEGs; (C) downregulated DEGs.
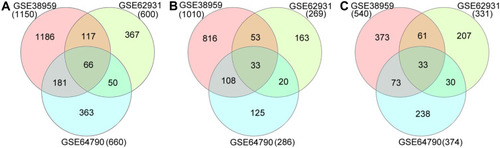
Table 2 Significantly Enriched GO Terms and KEGG Pathways
Figure 2 Enrichment analysis of DEGs and neighboring genes in triple-negative breast cancer. (A) Heatmap of enriched GO and KEGG terms, colored based on p-values. (B) Network of enriched GO and KEGG terms, colored based on p-values (terms containing more genes tend to have a more significant p-value). (C) PPI network. (D) Five most significant MCODE components from the PPI network. (E) DisGeNET data for the DEGs.
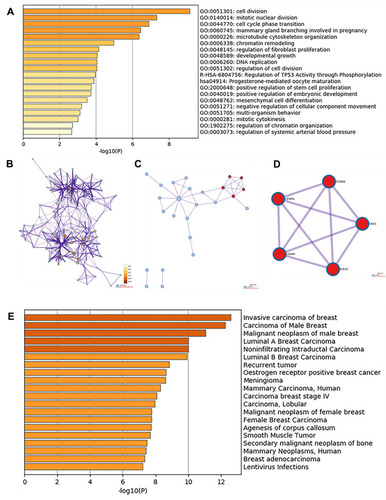
Figure 3 Transcription levels of the core genes in different types of cancers in Oncomine database (blue: low expression, red: high expression, comparison within the same line).
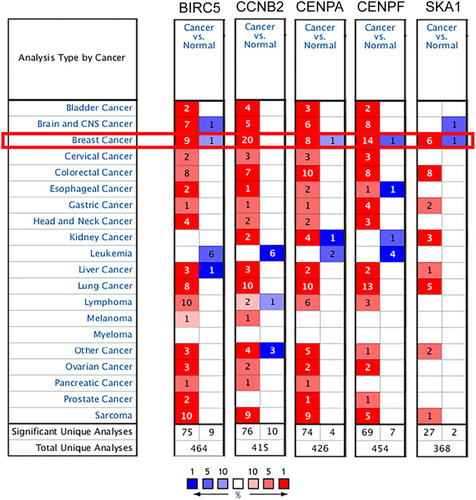
Figure 4 Expressions of the core genes in different breast cancer research microarrays. (A) CENPF expression in TCGA breast (1: breast, 2: invasive lobular breast carcinoma). (B) SKA1 expression in Turashvili breast (1: ductal breast cell, 2: lobular breast cell, 3: invasive ductal breast carcinoma). (C) BIRC5 expression in Curtis breast (1: breast, 2: medullary breast carcinoma). (D) CENPA expression in Curtis breast (1: breast, 2: invasive ductal breast carcinoma). (E) CCNB2 expression in Turashvili breast (1: ductal breast cell, 2: lobular breast cell, 3: invasive ductal breast carcinoma).
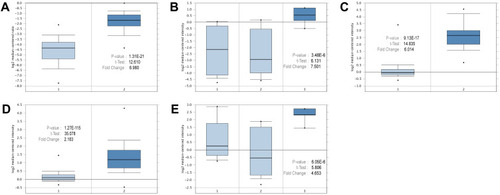
Figure 5 Prognostic values of mRNA expression levels of the core genes in patients with triple-negative breast cancer (Kaplan–Meier analysis). (A) Association of BIRC5 with RFS in TNBC. (B) Association of CENPA with RFS in TNBC. (C) Association of SKA1 with RFS in TNBC. (D) Association of CENPF with RFS in TNBC. (E) Association of CCNB2 with RFS in TNBC.
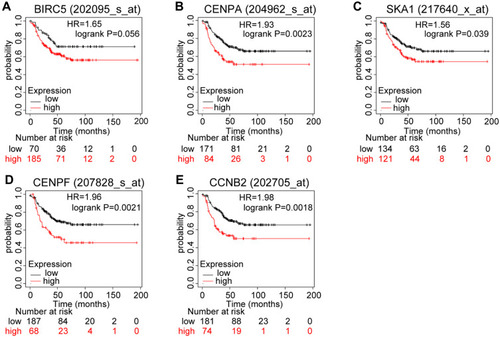
Figure 6 Immunohistochemical staining (EnVision Method). (A) CCNB2 is negatively expressed in the adjacent nontumor tissue at ×400 magnification. (B) CCNB2 is positively expressed in the triple-negative breast cancer tissue (magnification, ×400).
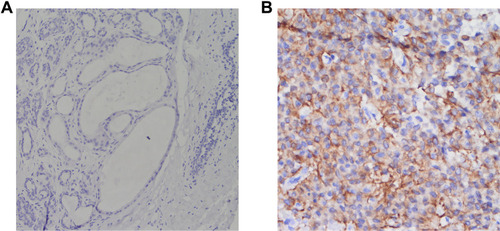
Table 3 Clinicopathological Characteristics and Kaplan–Meier Univariate Overall Survival Analysis of Patients with Triple-Negative Breast Cancer
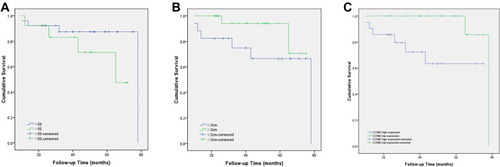
Figure 7 Kaplan–Meier overall survival curves according to the (A) patient age (p = 0.170), (B) tumor size (p = 0.143), and (C) CCNB2 expression (p = 0.022).